Trend lines and trend channels are 2 of the simplest and most effective charting tools. They form the basis of many charting patterns and are building blocks for price pattern recognition. Being able to correctly identify and draw trend lines and trend channels is a skill every trader should master. The principle is simple but so often they’re drawn incorrectly, essentially making them useless or worse a hindrance to traders. In the following post I will describe in detail how to draw trend lines and trend channels correctly.
What is a trend line?
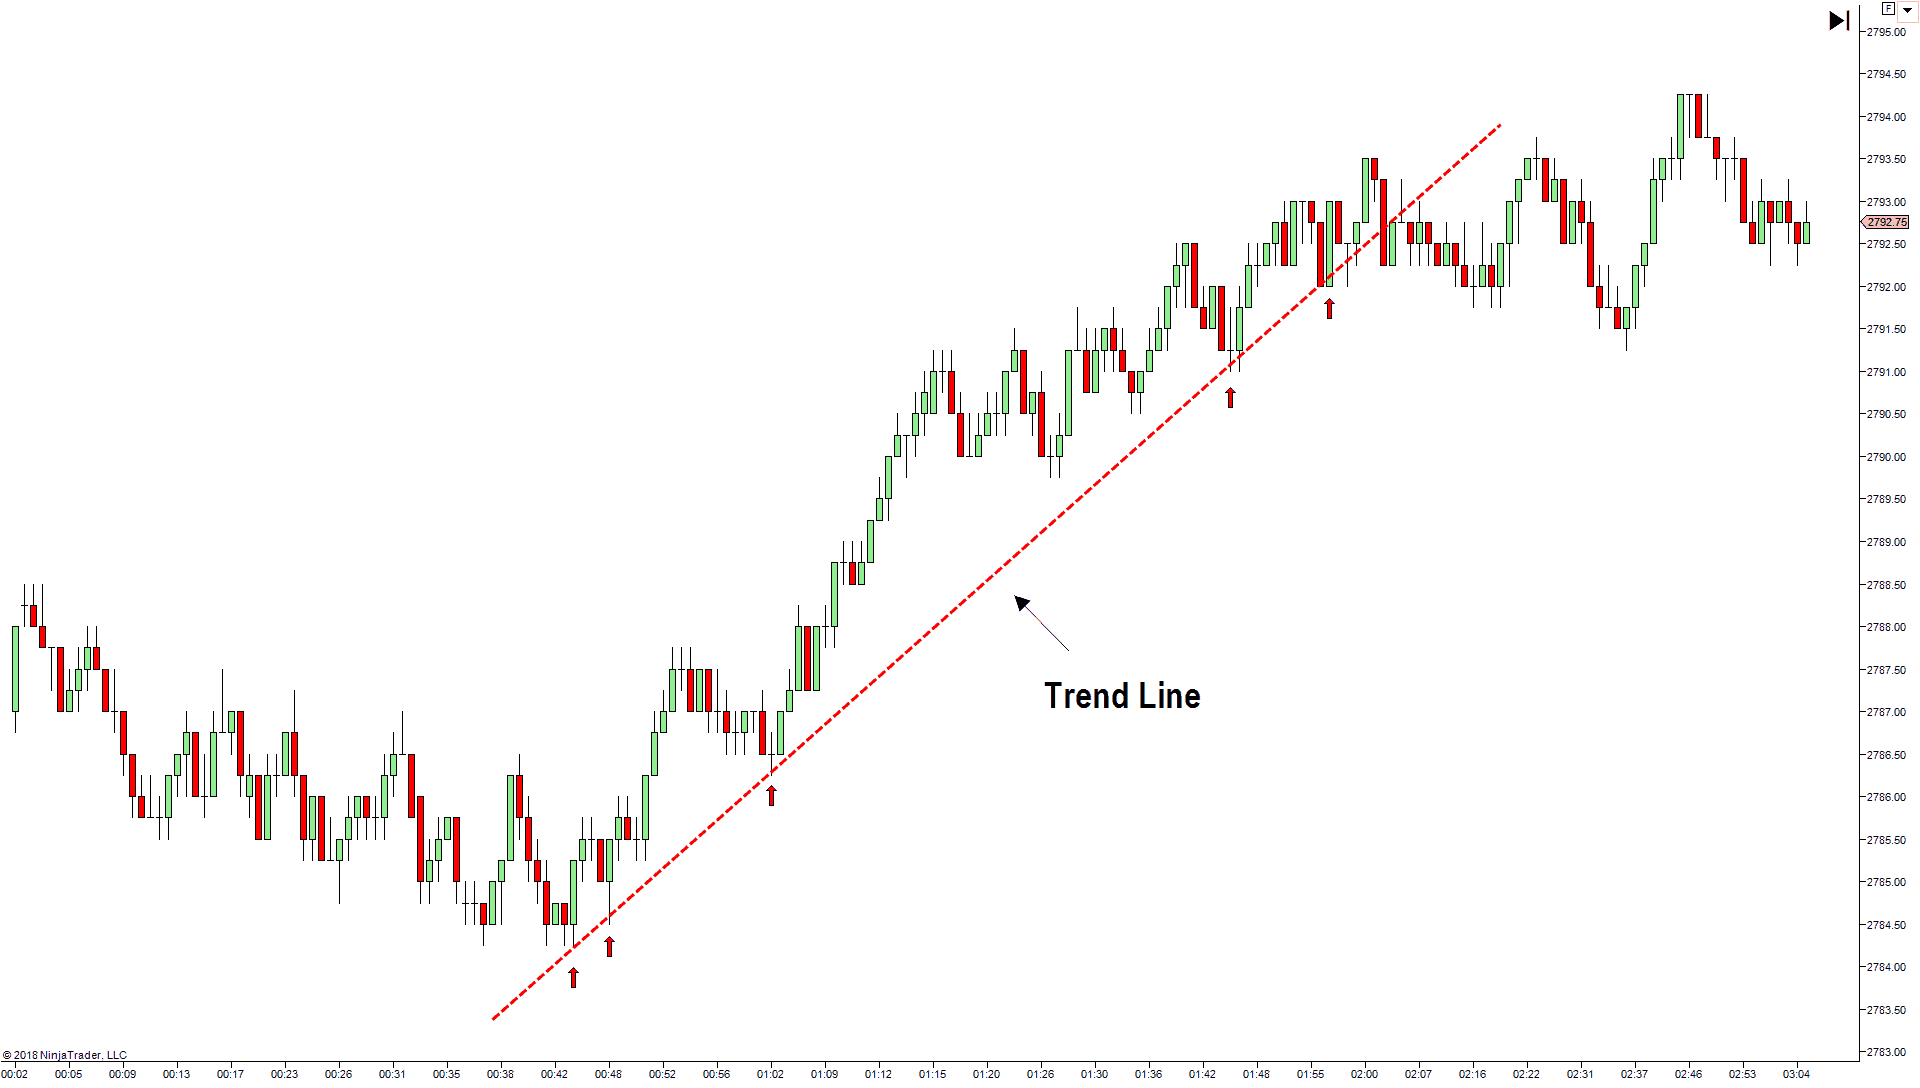
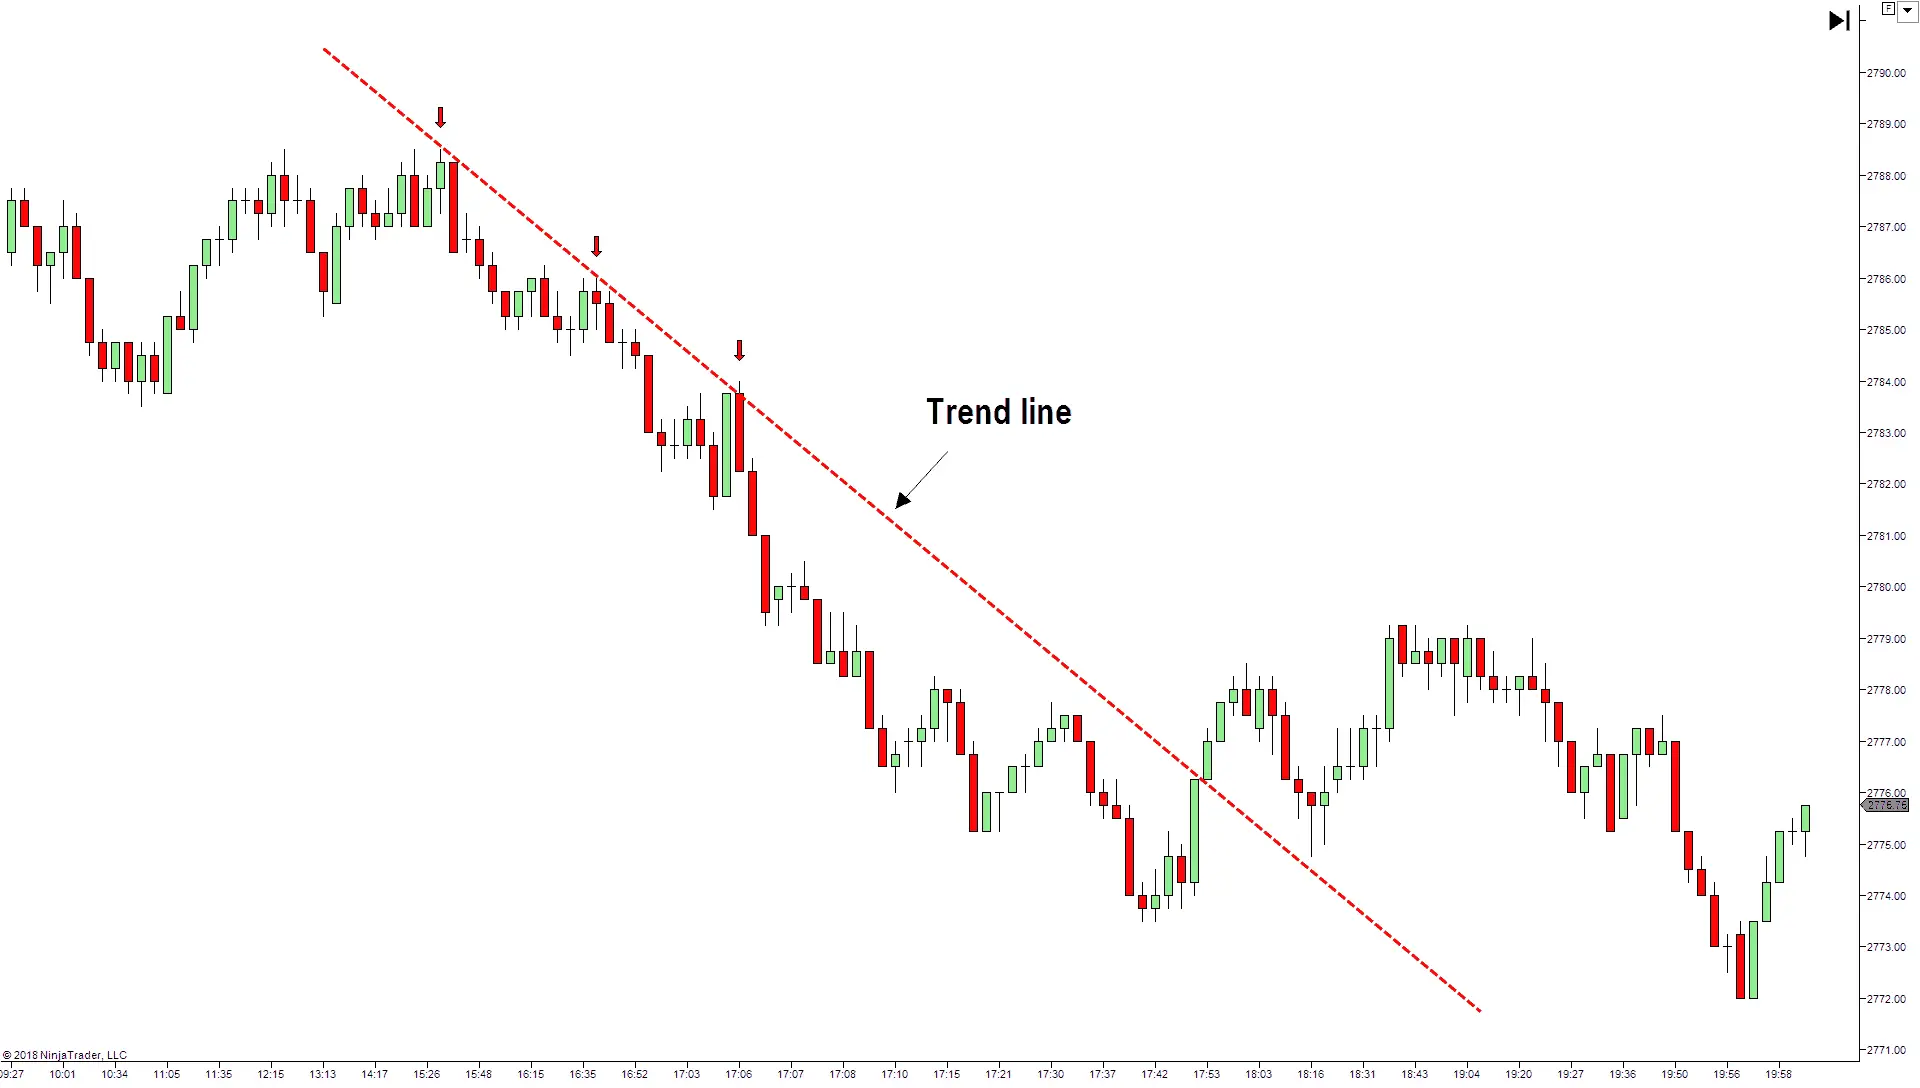
The first component of the of the trend channel is the trend line. A trend line is a straight line that joins 2 or more pivot points. In an ascending market these are higher lows forming an uptrend. In a descending market these are lower highs forming a downtrend.
Trend lines form 2 important functions:
- They provide support and resistance levels. Often referred to as dynamic support and resistance levels. These trend lines allow traders to identify areas of increased supply and demand and potential short term reversals.
- They provide insights into trend strength and market sentiment. A trend line break can signal a trend reversal.
What is a trend channel?
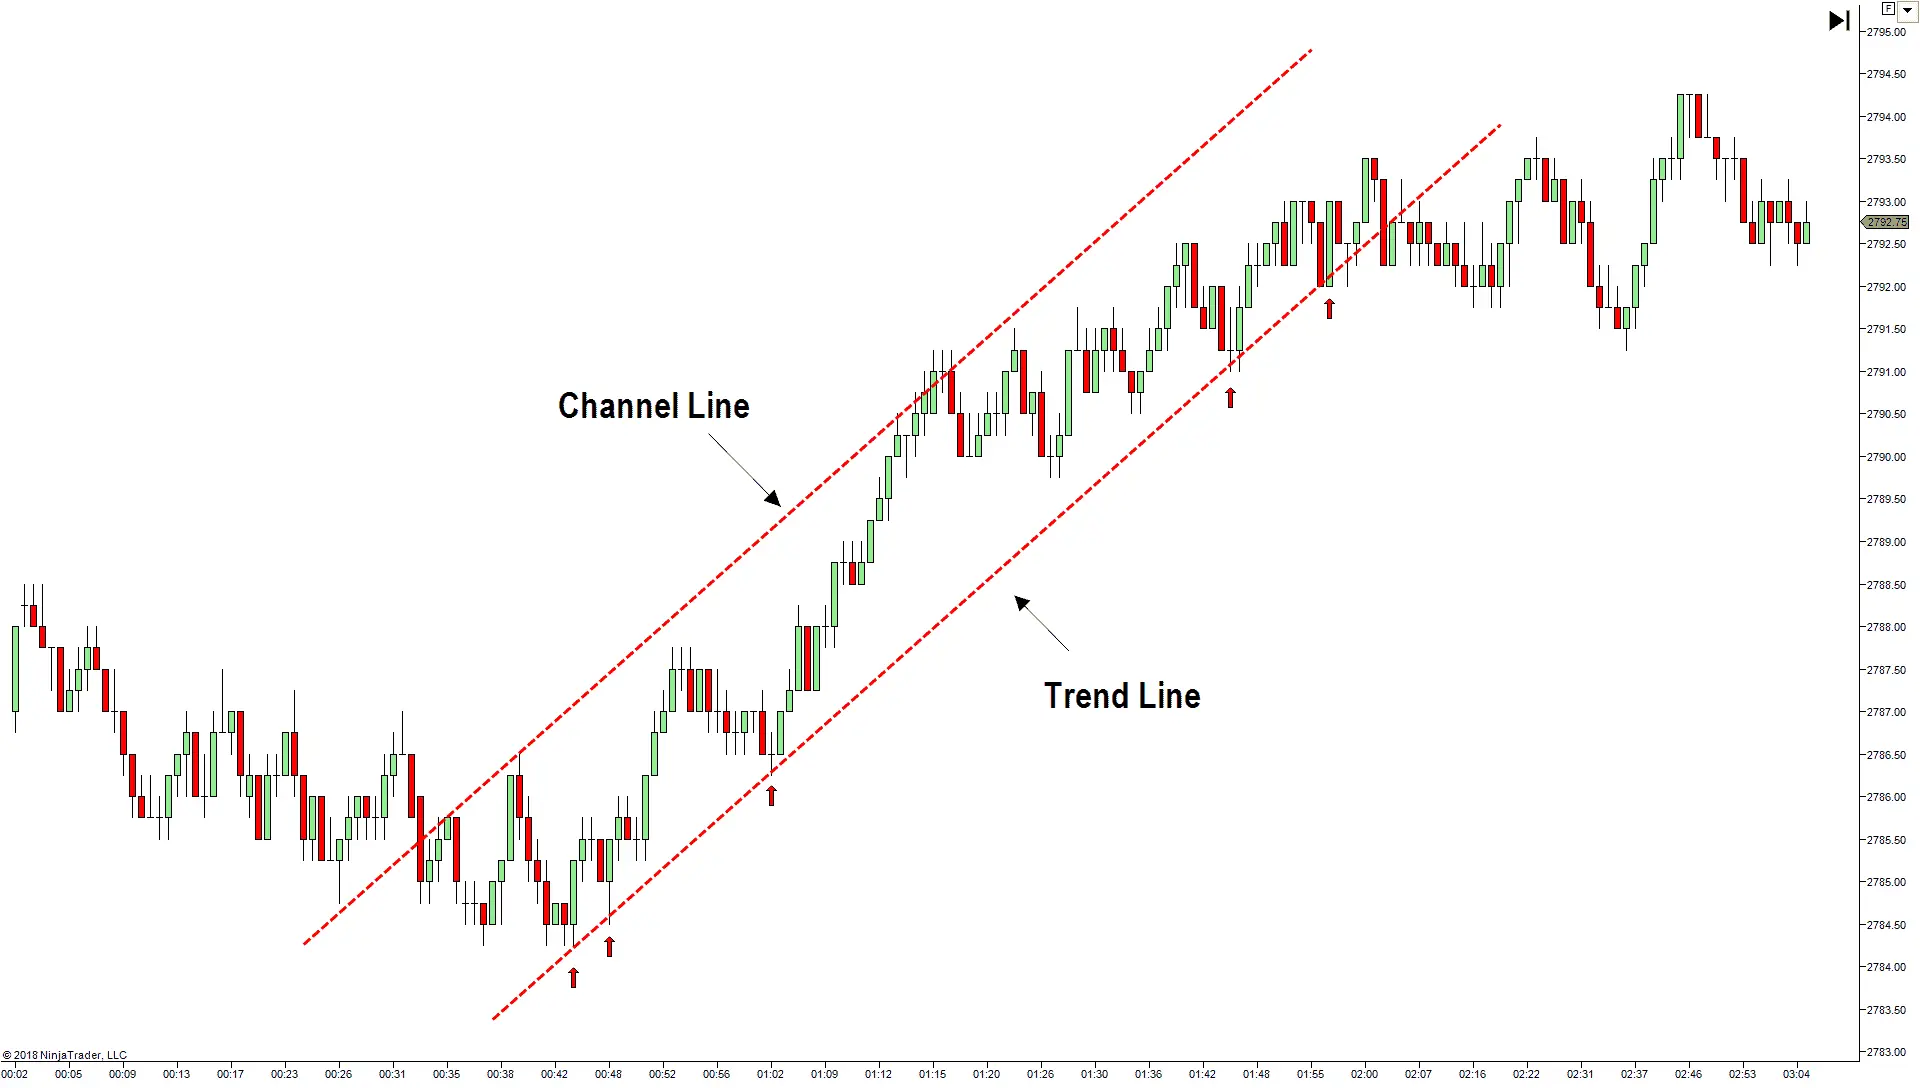
“Trend channels” or simply “Channels” are formed by transposing a line parallel to the trend line, called the channel line. The “Channel line” joins a series of higher highs or peaks in an uptrend and lower lows or troughs in a down trend.
The trend line and channel line act as “dynamic” support and resistance. They behave in the same way as “static” horizontal support and resistance levels. Price is bound between the trend line and the channel line.
Channels can also be constructed horizontally. This is known as a price range and represent price consolidation.
How to draw trend lines and channels correctly?
There are many differing opinions about how to correctly draw trend lines and trend channels. The following is a method that I use based on classical technical analysis techniques.
First lets recap on the 2 principles functions of trend lines. These are:
- Act as Dynamic support and resistance levels; and
- Provides insights into the strength or weakness of a trend.
Remember we are not always looking for confirmation of the trend but also looking for indications of strength or weakness in the market trend. A trend line and trend channel can tell us whether the trend is likely to continue; equally any weakness in the trend suggests that we could expect a reversal. Mastering the subtleties of trend line and trend channel interpretation will come with experience and screen time.
For now its important to understand the simple methods to build an understanding around. This starts with mastering how to draw trend lines and trend channels correctly.
How to draw trend lines?
When looking to draw trend channels the first thing to do is define the trend line. This is a very simple yet I see so many traders doing this wrong!
The most important thing to remember is that in a uptrend the trend line is always traced BELOW price. The trend line acts as support as price trends upward. In a down trend the trend line is traced ABOVE price and acts as resistance. NOT the other way around, as I see so many educators and traders doing.
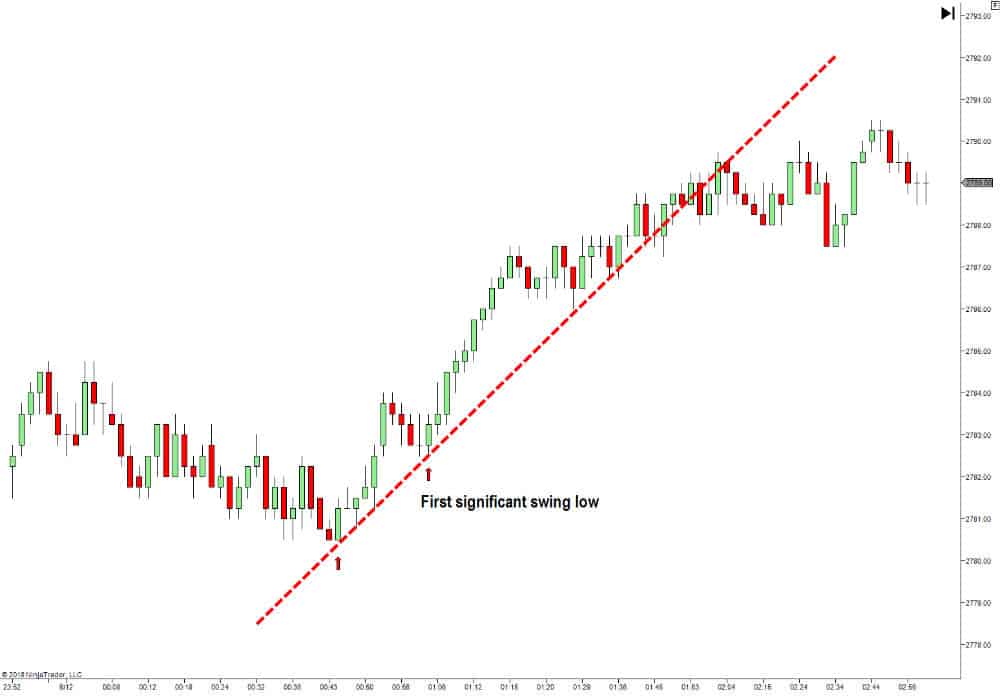
To draw a trend in a uptrend, first find a major swing low in the price action. From this swing low trace a line to the next significant higher swing low. In an uptrend we are looking to see price supported by the trend line indicating strength and that the trend line is relevant.
To find the correct pivot points or market turning points to draw the trend line through, we are looking for “significant” swings. This is where there is some element of interpretation and experience required. This mostly depends on scale of the move being analyzed or chart size (time or tick) being traded. mastering this will also come with experience.
“Draw a line from a major swing low to the first significant higher swing low”
The trend line in a down trend is drawn the opposite. Start with a significant swing high in the price action. From this swing high trace a line to the next significant lower swing high. In a down trend we are looking for price to find resistance at this trend line.
How to draw trend channels?
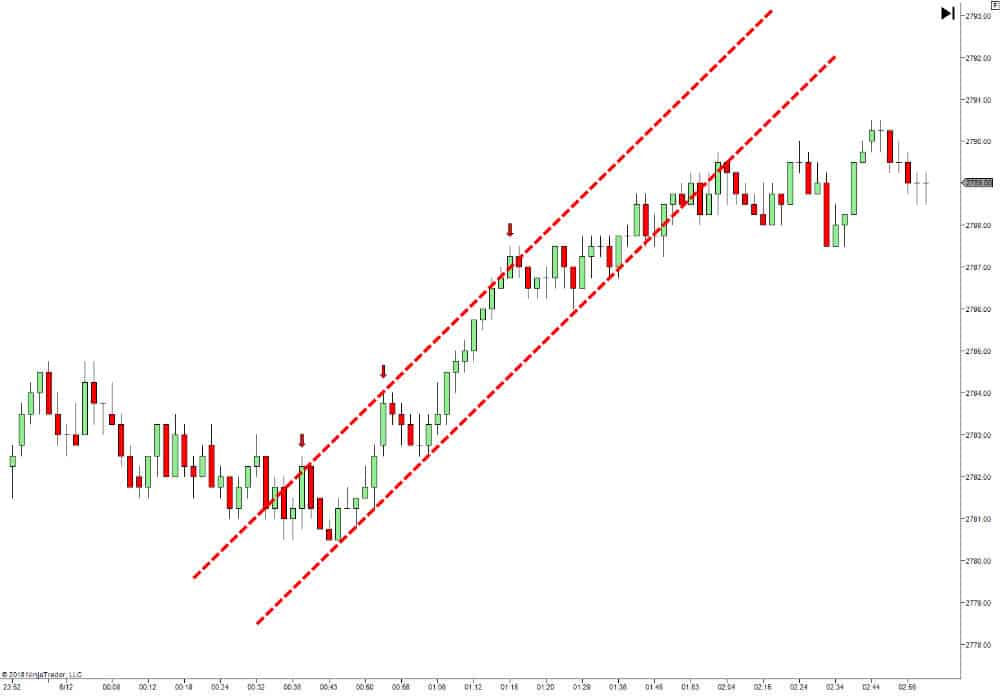
With the trend line in place. Creating the channel is easy. Copy the trend line and drag this new line into position. This new line is known as the “Channel line”. In an uptrend drag the channel line above the trend line to fit neatly against higher swing highs.
Often there may be only a single higher swing high, this is OK. More often than not you will find 2 or more swing highs to match the trend line.
Do the opposite to draw trend channels in a down trend. Drag the Channel line below the trend line to fit neatly against the lower swing lows.
Do you use the candle wicks or candle closes to define the trend line and channel line?
Traders often disagree about whether they should be using candle wicks or candles closes to draw technical levels. Here is my take on it, with justifications for my thinking:
Unless the candles represent the end of days trading or the end of a significant sessions trading, the candle closes have little relevance. For example the candle close on a one minute or 500 tick chart simply represent a single moment in time or an arbitrary contract traded that have no greater weighting than any other time or contract trade. Therefore I always use the candle extremes. The candle extremes represent the high or low of trading and have far greater weighting for drawing trend lines or technical levels.
That said trend line analysis is not an exact science and more often than not trend lines will not always fit perfectly. There will always be some “curve fit” involved. Nevertheless I’m sure you’ll be amazed at how well they do fit. Especially if you use the method described in this post.
How to confirm a trend line and how to trade trend lines and channels?
Strictly speaking a trend line is not confirmed until it is defined by 3 swing highs or lows.
This works in hindsight but in practice waiting for a third swing high or low often means getting late into a move. The third leg is often the final push unless it is a major trending move and typically I’m wanting to be in before this confirmation and out before any weakness or trend reversal.
This is the beauty of using trend channels and why I regard them as one of the 5 best technical analysis tools.
As a general rule I trade trend lines and trend channels like I do support and resistance. Trading always with the trend and getting long at trend lines in an uptrend and short at trend lines in a down trend. Trend Channels help frame price trends and provide insights into the strength or weakness of the trending move.
In a follow up post I will describe in greater detail how I trade trend channels and how I use then to identify market strength and weakness for trend continuation trades or potential reversals.
Summary
- Trend lines and trend channels can be thought of as dynamic levels of support and resistance.
- Trend lines should always be drawn from swing lows in an uptrend and swing highs in an downtrend.
- “Trend lines” and “channel lines” should be drawn through candle extremes of the swing high and lows, unless trading candles that represent significant trading sessions. For example daily candles with New York close or Asian, European or US Session closes.
- Trend lines and trend channels can be traded like support and resistance. Trend channels provide insights into the strength of a trending move.