The TradingView long position tool and short position tools is a brilliant feature of the TradingView platform.
In this post I’ll provide a detailed guide to using the TradingView long position tool and short position tool and how to get the most out of them! I’ll explain how they can be used to easily calculate risk reward ratios and as a TradingView position size calculator.
Signup for a Essential, Plus+ or Premium TradingView subscription using the link. *New users get $15 towards a new plan.
What is the TradingView Long position tool and short position tool?
The long and short position tools are one of the freely available drawing tools on TradingView. These tools play crucial roles in pre-trade assessment which includes calculating position sizing and risk reward ratios.
The TradingView long and short position tool is a visual prediction charting tool that allows uses to overlay entry, stop loss and take profit targets directly on a chart. The tool can also be edited via a settings window where precise inputs can be made. Here users can calculate risk reward ratios and position sizing based on a dollar amount risk.
Be sure to check out the How to use TradingView Position Size Calculator section below. Where I will explain in detail how to use this brilliant feature!
TradingView Long position tool and Short position Tool Overview
Main Features
1. Long and Short Positions
The tool supports both long and short positions. These are listed as separate tools in the tool bar.
2. Position Sizing Calculator
This is a feature that I think is really nice and that not a lot of traders take advantage of. There’s no need to use a separate position sizing tool with TradingView. The long and short tools work as a position sizing calculator! Brilliant! Check out the ‘How to use TradingView Position Size Calculator’ section below.
3. TradingView Risk Reward tool and Calculator
The position tool provides a visualization of a trade’s Risk to Reward ratios. This tool eliminates the need to do manual risk management calculations.
4. P&L Statistics
The tool displays a snapshot of your P&L key statistics: profit target, stop loss, and open P&L.
All this information is listed directly on the charting tool graphic.
Profit target and stop loss P&L statistics include gains/losses as a dollar amount or the quote currency of the asset, a percentage of your account balance and an account balance change amount.
The Open P&L displays the current P&L in a dollar amount or the quote currency of the asset traded. I’ll go into more detail about each of these in the sections below.
5. Easy Setup
TradingView provides two really easy ways to set up the tool:
- Through filling up the fields in the settings window inputs
- By drawing directly on the chart.
The settings window is a great way to precisely setup the tool. The settings then automatically update computations on the chart once changes are made. I’ll explain in detail how to use the TradingView Long position tool and short position tool in the section below.
6. Easy Adjustment
The entry point, profit target and stop loss points are really easy to adjust or modify. The tool can be adjusted through drag, adjust, and drop features similar to normal drawing tools.
The input tab can also be used to adjust the parameters more precisely.
7. Easy Interpretation
This tool looks great on your charts. It’s super easy to read and interpret. It allows uses to quickly see trading plan key metrics and trade performance:
The position tool shows a green and red colorway by default. The color of a particular area or price level represents either profit (green) and loss (red)*
The color of the Open P&L will either turn into green when the position is making money or turn red when losing money. The profit or loss is in reference to the last price of the last candle.
*Colors are customizable in the Style tab
Main Elements
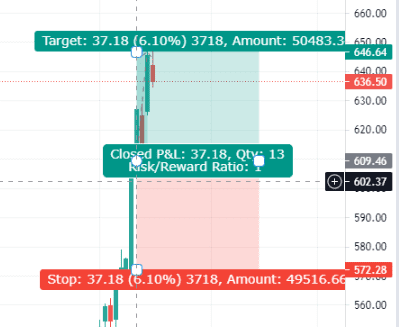
Before we dive into the elements, it’s better to first understand the main levels (otherwise referred to as “panels”) that make up the TradingView long position tool and TradingView risk reward tool. The tool draws a three-tiered channel marked with the following elements:
- Entry Price
- Target Price
- Stop Loss Price
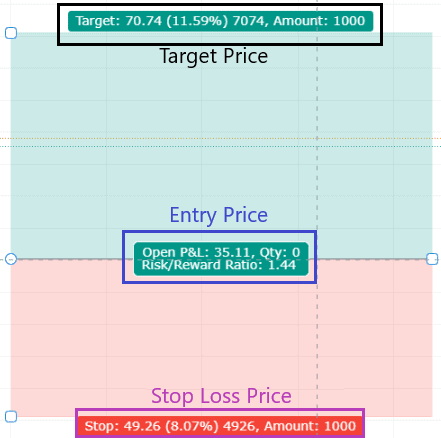
As shown above, each of the three levels have their own set of sub-elements. We will discuss more of these below:
Entry Price
- Open P&L [1]
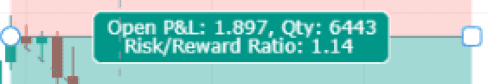
- Shows simulated P&L as computed from the entry price versus last traded price. This amount is listed in the base currency of a single unit of the asset. For example if the entry price is $610 and price moves to $620 then the Open P&L will display as 10.
- Listed in USD or in base currency of the asset
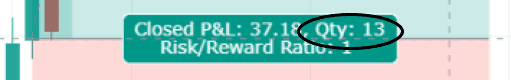
- Quantity [2]
- The number represents the quantity of shares to be purchased at the entry price based on the risk and account balance of the user.
- Functions similar to a position sizing calculator – more on this in the last section
- Risk Reward Ratio [3]
- The numerical representation is in ratio format which is interpreted as the potential profit for every unit risked.
- Simulated Entry [4]
- The line dividing the green and red is the price at which the position will be entered.
- Read in reference to the Y axis (price)
- Displays as a gray colored flag on Y-Axis
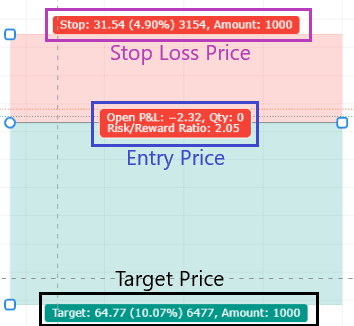
Stop Loss
The stop loss price is the lowest tier (for long position) or the highest tier (for short position) in the tool drawing. It is denoted by the color red.
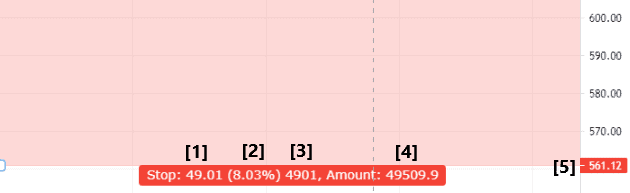
The Stop Loss level includes (in order):
- Potential loss ($) [1]
- Loss presented in dollars or base currency of a single unit of the asset.
- Difference from target price and entry price
- Potential loss (%) [2]
- Loss presented as a percentage of your account balance.
- Potential loss (ticks) [3]
- Loss presented in ticks/pips.
- Difference from target price and entry price
- Account balance [4]
- Projected account balance assuming exiting at stop loss
- Computation based on the user-inputted account balance.
- Stop loss level [5]
- The stop loss level in asset base currency amount.
- Denoted by the faint line at the end of the red zone listed in Y-Axis.
Target Price
The target price is the highest tier (for long position) or the lowest tier (for short position) in the drawing. It is labeled by the color green channel.
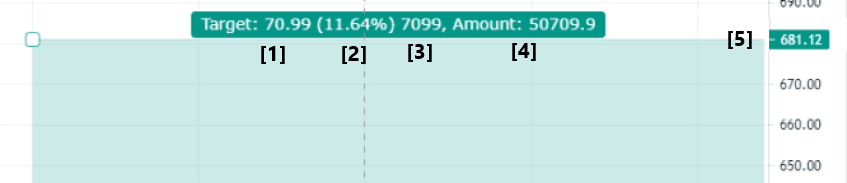
The Target Price level includes (in order):
- Potential profit ($) [1]
- Profit as represented in dollars or the base currency of a single unit of the asset.
- Difference from target price and entry price
- Potential profit (%) [2]
- Profit as measured as a percentage of your account balance as listed in the tool settings.
- Potential profit (ticks) [3]
- Profit as measured in ticks/pips
- Difference from target price and entry price
- Account balance [4]
- Projected new account balance assuming exiting at price target
- Computation based on the user-inputted account balance.
- Price Target level [5]
- The price target level in asset base currency amount.
- Denoted by the faint line at the end of the green zone listed in Y-Axis.
How to use the TradingView Long position tool and short position tool?
In this part of the post, I will provide a step-by-step guide on how to use the TradingView long position and short position tool.
Signup for a Essential, Plus+ or Premium TradingView subscription using the link. *New users get $15 towards a new plan.
Adding the Long Position or Short Position Tool
Step 1: Launch chart
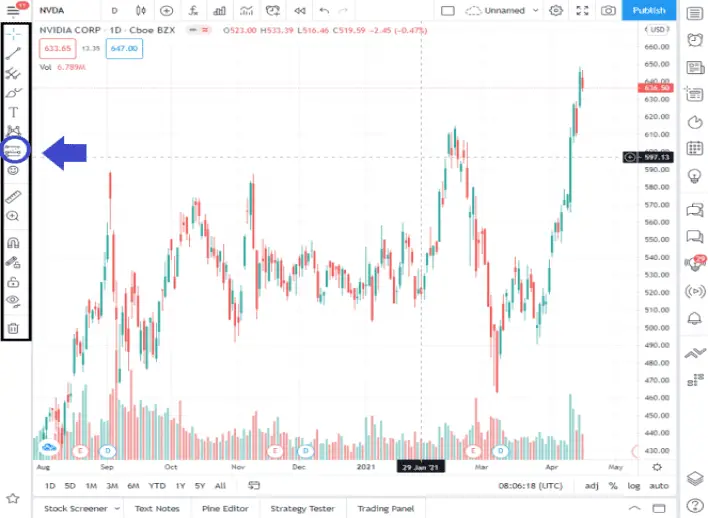
Step 2: Locate the drawing panel on the left of your chart (see black box below).
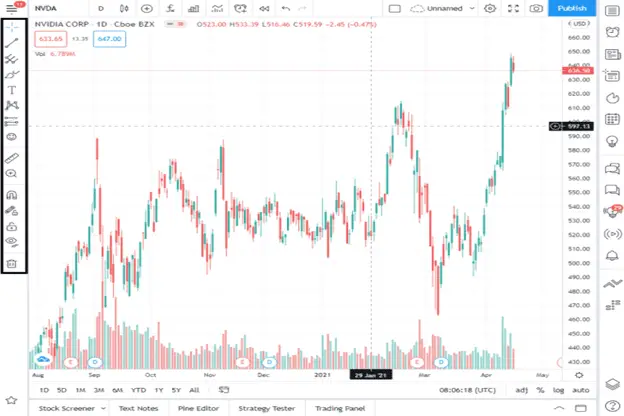
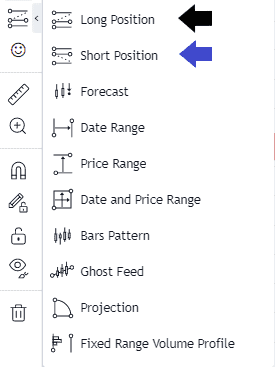
Step 3: Locate the ‘Prediction and Measurement Tools’ on the Drawing Panel > Hover on this icon (See blue arrow and circle below).
Step 4: Click the arrow to the right of the icon. This will open a drop-down menu of all Prediction and Measurement tools.

Step 5: Select either TradingView Long Position (black arrow) or TradingView Short Position (blue arrow). Clicking this will activate the drawing cursor on your chart.
Step 6: Select your simulated entry point by pointing at a specific area on your chart then left click once.
In the illustration below, the cursor is pointed at the 609.46 level.
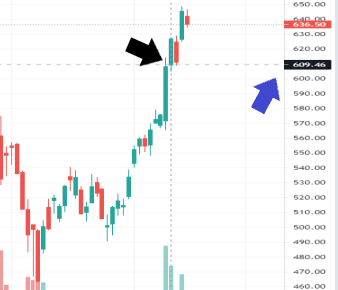
A simulated drawing of your P&L will instantly appear based on default settings and your chosen entry point. See figure below.
Step 7: Adjust the Stop Loss, Profit Level, Entry Level by moving the handles on the sides of the tool channel:
Entry Level
Consists of two handles:
- Circle-shaped handle: Adjust the entry point (scalable up and/or down, left and right).
- Uses price reference on the Y-axis.
- Square-shaped: Adjust the (date or timeline) coverage of P&L computation (only scalable left and/or right).
- Uses date reference on the X-axis.
Target Price
- Adjust the target price using square-shaped handle (scalable up and/or down).
- Uses price reference on the Y-axis.
Stop Loss Price
- Adjust the stop loss price using square-shaped handle (scalable up and/or down).
- Uses price reference on the Y-axis.
Note: As you may have noticed, it’s difficult to pinpoint a specific entry/profit/stop loss point using the cursor and handles. A better way to set a precise entry price is to use the manual input option through its settings Input tab.
We’ll go into detail about this in the next section.
Modifying and Adjusting the Long and Short Position Tool
The Long and Short Position tool can be customized based on a user’s personal preferences including users account balance for position sizing (more on this later).
The following is a list of users inputs that can be used to amend tool settings:
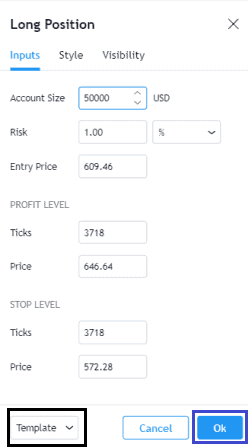
Inputs Tab
Step 1: Double click your long/short position drawing tool on chart. The custom settings window will open.
Step 2: Fill in each of the fields. To understand each field, refer to the short descriptions below:
- Account Size
- Input your actual account size in USD.
- Risk
- Input your risk either in percentage (%) or in USD ($)
- There is no standard rule of actual risk values but most people suggest 1-2% to start.
- Entry Price
- This is where you precisely input entry price.
- By default, the entry price shown is the point selected on the chart when placing the tool.
Fields under PROFIT LEVEL and STOP LEVEL
- Price
- Price level you want to take profit or loss.
- Ticks
- Amount in ticks/pips away from entry price to take profit or loss.
- By default, TradingView computes this by the difference between the Target Price and the Entry Point.
Note: Changing the value of price or ticks fields will automatically compute the value of the other field.
Step 3: Click Template (black box)then ‘Save As’ to save version as template or Click OK (blue box) to immediately apply the changes.
For more details on how and why create a TradingView template check out my detailed post.
Style Tab
The TradingView long position and short position tool can be customized for colors, line types and text sizes in the ‘Style’ tab:
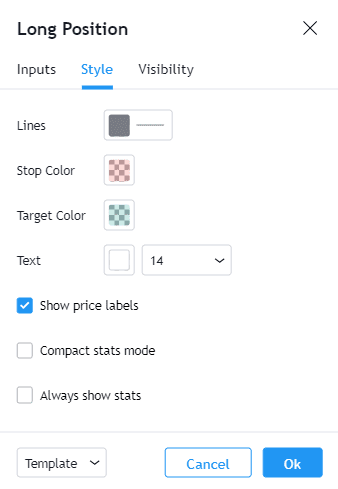
Customize your drawing design by changing the following elements:
- Lines
- Stop Loss Color
- Target Price Color
- Text color and size
- Compact stats mode
- Helpful feature that compresses the stats to take lesser space
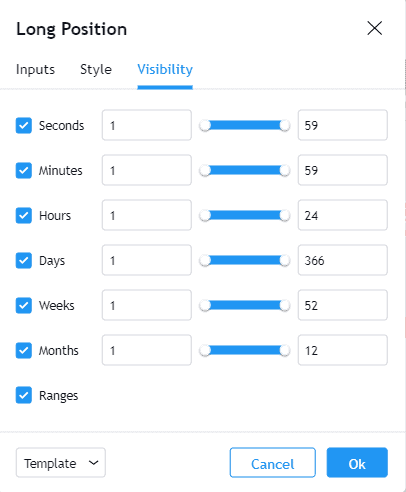
Visibility Tab
This tab will enable/disable the display of your drawing on specific time intervals.
Some Useful Drawing Tips
Right clicking on your drawing will reveal several options to enhance your drawing experience.
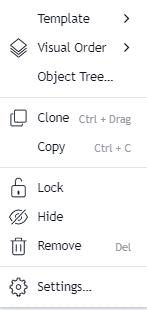
Tip 1: Lock / Unlock
This feature will lock your drawing. A locked drawing will keep the drawing will not move the object in a single position. It can’t be accidentally moved by mistake.
Tip 2: Clone (shortcut: CTRL + drag)
This will clone your existing drawing. You can drag this on other areas of the same chart.
Tip 3: Remove
Deletes your drawing.
To undo an accidental deletion, key in CTRL + Z from your keyboard.
Tip 4: Hide / Unhide
Temporarily remove your drawing from the chart.
To unhide, click the same button
How to use TradingView Position Size Calculator
Apart from projecting P&L, the Long and Short Position tool can also be used to calculate position sizes.
By definition, Position Size is the quantity of shares, lots or contracts you take on a trade. Position Sizing is one of the crucial factors in risk management. Correct position sizing is the single most important factor in good risk management.
TradingView automates the calculation of position sizing. It takes into consideration two values when computing: Account Size (account risk) and Risk (trader risk).
I so often see TradingView users, using a third party position size calculator. But there is really no need since TradingView has a very easy to use position size calcultor built into the Long and short position tools.
To use the TradingView position size calculator follow these steps:
Step 1: Add long or short position tool to your chart. See how to use the TradingView long position tool and short position tool section above.
Step 2: Open the tool Settings by double clicking on the position size drawing tool on your chart.
Step 3: In the Inputs tab, fill the ‘Account Size’ field – This is your account size in USD or the quote currency of the asset being traded.
Step 4: Fill the ‘Risk’ field (% or in USD or base currency of the asset being traded)
Step 5: Click ‘OK‘
The drawing should show the “optimal” position size based on the account balance, risk and stop loss location. See black circle below.
Note: The unit of quantity shown above will depend on the type of asset on the chart.
See the types of quantity units unique to each asset below:
- Stocks: Quantity displayed is in number of shares.
- Futures: Quantity displayed is in number of contracts.
- Forex: Quantity displayed is in number of base currency units to trade. However in forex its not that simple since forex trades in lots. To understand how many lots to trade based on base currency units see the following section:
Understanding Forex Lot Sizes
Calculating position sizing in forex can be a little confusing. In this section I hope to clarify position sizing using lot size.
Units of trade in the forex are call ‘Lots’. There are several types of lot sizes depending on your brokerage account settings.
Lot sizes can be Standard (100,000 units), Mini (10,000 units), Micro (1,000 units) or Nano (100 units). Lots sizes are equivalent the amount of the base currency being traded.
TradingView Forex position Size Calculation
In the example below the TradingView position sizing tool calls for a quantity of 6443 base units of currency to be traded. Calculating the number of lots you require to trade is simple as long as you understand lot sizing and know the type of lots your account is trading in.
The simple calculation for number of lots to trade is as follows:
Number of Lots to Trade = Qty / Number of Units in Lot
Where to the ‘Number of Units in lot’ for Standard Lot is 100,000 units, Mini is 10,000 units, Micro is 1,000 units and Nano is 100 units.
Therefore if your forex account is denominated in Mini Lots (10,000 units). The number of lots to trade equals 6443/10,000. This means you need to trade 0.6443 lots. SIMPLE!
The key is to understanding the lot position sizing is to know your what lots size your account is denominated in and how many units that lot size represents!
Signup for a Essential, Plus+ or Premium TradingView subscription using the link. *New users get $15 towards a new plan.