In this post I’ll discuss the best VWAP indicator mt4 and mt5.
I’ll discuss what is VWAP, how VWAP is calculated. Discuss the key features and main functionalities of each VWAP indicator mt4 and mt5. I’ll also show you how to setup each indicator on your charts and show you how to get the most out of each indicator.
What is VWAP?
Volume Weighted Average Price or popularly known as VWAP is a numerically based benchmark that gives a volume weighted average of an instrument for a particular day. The VWAP gives a more clear and accurate representation of an average price of a stock or instrument in a given day by factoring in volume executed at specific price points when computing the average. The higher the volume on a particular price point, the more skewed the (day) average will be towards that price value.
The VWAP value is commonly used by institutional investors and mutual funds as a benchmark price in entering and exiting positions. For traders, VWAP is commonly used as a gauge of trend strength.
As an indicator, the VWAP maps out a trend by drawing a line akin to a moving average.
How is VWAP calculated?
The VWAP formula is laid out as follows:
VWAP= ∑ (Price * Volume)/ ∑ Volume
Best VWAP Indicator MT4
MetaTrader 4 offers the VWAP indicator on its platform through custom indicators programmed by users and authors. Among the popular ones is an indicator created by PipTIck.
PipTick VWAP Indicator MT4 Overview
PipTick offers their proprietary VWAP indicator for a fee in both MetaTrader 4 and 5. Created in 2015, this indicator offers five different modes that map out varying perspectives of the VWAP.
Users can analyze VWAP figures from the perspective of different timeframes with the added ability to plot the VWAP like a Moving Average line.
The indicator was last updated in 2020.
Features
Multiple Modes
With its multiple optional modes, PipTick VWAP offers users the ability to analyze VWAP through different lenses. The main difference among the 5 modes is how the VWAP is presented and/or represented in different timeframes.
Learn about the following modes below:
- Moving – The VWAP is plotted in a line similar to a moving average indicator
- Daily – The VWAP is calculated with a timeframe that begins at the start of the day to the end of the day
- Weekly – VWAP calculation begins from the start to the end of the week
- Monthly – VWAP calculation begins from the start to the end of the month
- Session Time – User-customized: user can set the start and end hour his/her discretion
VWAP Band
Operating akin to a Bollinger Band, this indicator offers a visual of a channel with a first, second and third standard deviation option. Some traders may use this band to spot reversals.
Smooth and Fast
The PipTick VWAP indicator is fast and smooth promoting an excellent user experience while getting the job done.
Customization Ability
Users can customize the periods, start and end hours as well as personalization options like colors and line widths.
Straightforward Interpretation
Essentially, the PipTick VWAP is very easy to interpret regardless of experience level. Beginning traders with little experience with indicators can easily grasp the essence of the indicator.
Pros and Cons
| Pros |
- Offers a free demo available using strategy tester.
- Multiple modes (moving, daily, weekly, monthly, session time).
- Channel that displays 1st, 2nd, 3rd standard deviation from VWAP.
| Cons |
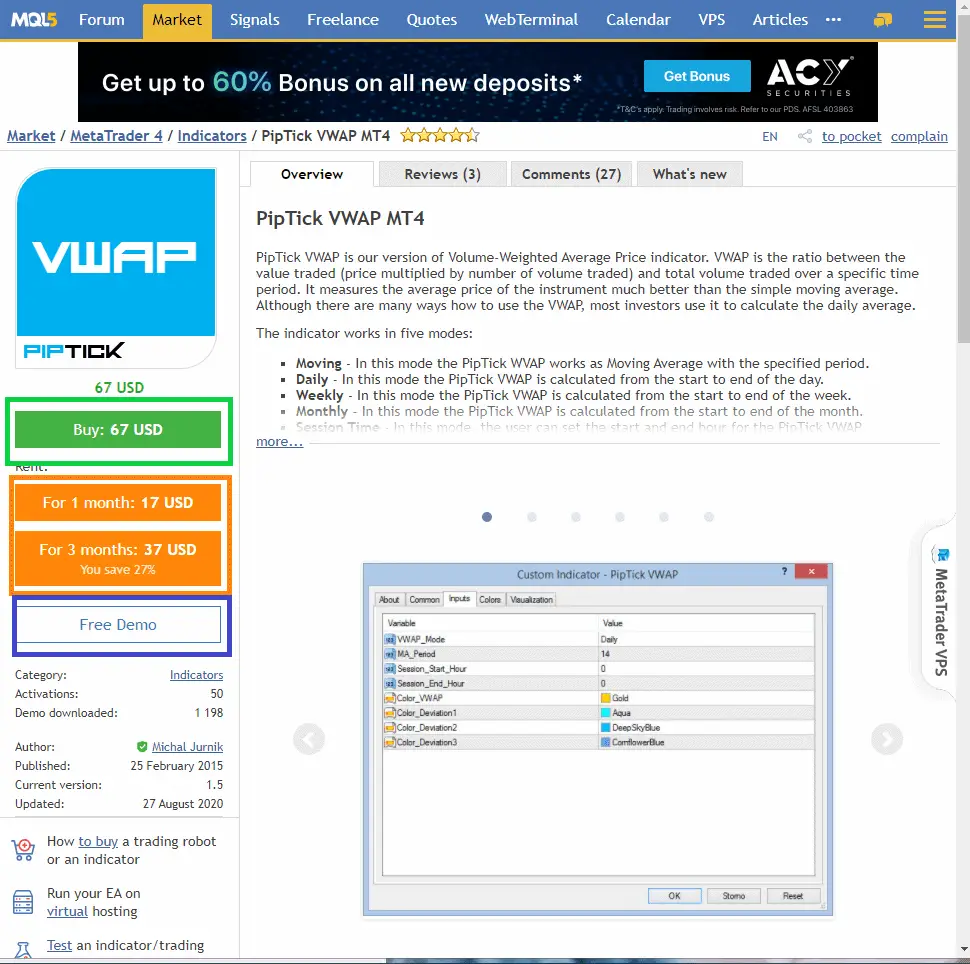
- Not a free download; Hefty price tag$67 one-time purchase $17 rent for 1 month $37 rent for 3 months.
- Developer does not release frequent updates. Updated 2020, the previous update was released 4 years earlier.
- Indicator is quite CPU intensive, some processes cause MT4 to slow down/crash.
How to Setup and Use PipTick VWAP Indicator MT4
How to Find the Indicator
The PipTick VWAP Indicator can be purchased/rented/downloaded at the link.
One-time Purchase
Click buy (see green box below) to purchase the indicator. The website will then redirect you to the payment page in MQL5.
Rent
Click either the 1-month or 3-month (see orange box below) rent option for a temporary subscription. The website will then redirect you to the payment page in MQL5.
Free Demo
Click Free Demo (see blue box below) to download the demo version for free. This option will launch MT4 automatically and will integrate the free demo to the indicator library.
Note: The platform may require you to login in to your MQL5 account
How to add PipTick VWAP Indicator to Chart
This section of the guide assumes that the PipTick VWAP indicator is downloaded and installed on the MT4 platform. To add the indicator, follow the steps below:
Step 1: Click Insert see black arrow below
Step 2: Select Indicators see orange box below
Step 3: Select Custom see purple box below
Step 4: Locate and select PipTick VWAP MT4 see blue box below
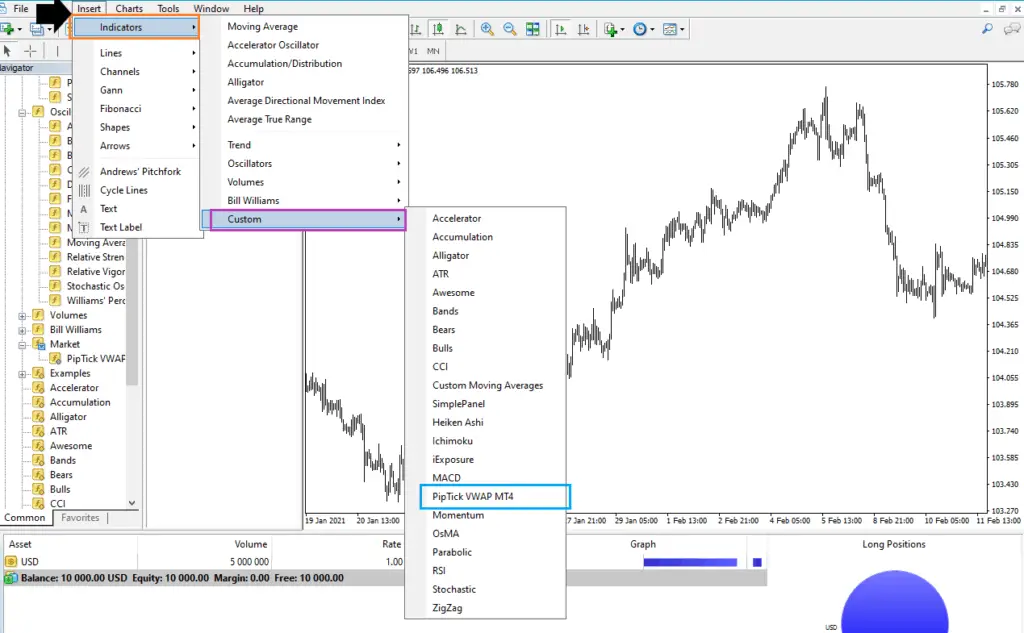
The properties window should automatically appear. You may opt to accept default settings for now to see the indicator uploaded to your chart.
Basic Settings: Input Parameters
As mentioned above, the properties window is where users can adjust input parameters to their liking. To keep the setup process simple and easy, I will share the default settings in these inputs and demonstrate how it would appear visually on the chart.
The Variable inputs (see black box below) are the core inputs while the Value column (see blue box below) represents the parameters that will characterize your VWAP indicator.
Note: these default settings can be adjusted by the user.
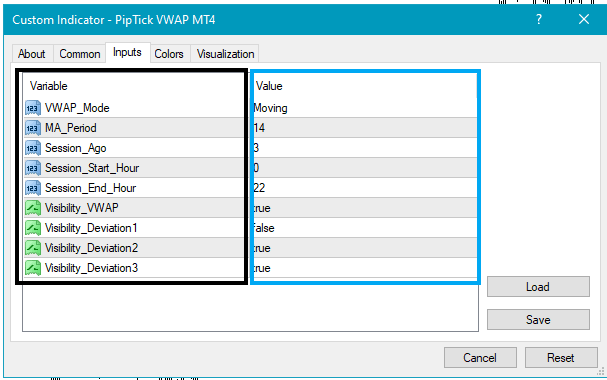
- VWAP Mode
- Choose from the dropdown menu
- Select from 5 modes: daily, weekly, monthly, moving, and session time
- Default selection: Moving
- MA Period
- The timeframe or period for the MA calculation
- Manually input the period you would like to study
- Default selection: 14
- Session Ago
- Session amount in a selected period
- Default Selection: 3
- Session Start Hour
- Set the starting hour for the session
- This will only work if Session Ago is enabled
- Session End Hour
- Set the ending hour for the session
- Similarly, this will only work if Session Ago is enabled
- Visibility VWAP
- Enabling and selecting True will display VWAP
- Choose between True or False
- Default Selection: True
- Visibility of Deviations 1-3
- Enable to display the first/second/third standard deviation lines
- Each deviation has its own enable/disable toggle
- Choose between True or False
- Default Selection: True (for 1 and 3) False (for 2)
Accepting the default input parameters will make a 3-line formation with the Standard Deviation lines (1 and 3) appearing as a color-coded pair (e.g., Standard Deviation 1 in light blue).
The default settings is already a good starting point for first-time users of the VWAP indicator.
Customizing Settings: VWAP Period, Colors
Users can adjust default input parameters. One of the key input parameters to take a look at is the VWAP Period and VWAP Mode.
Beyond input parameters, users can also modify style and color.
VWAP Mode and Period
- VWAP Mode
- Apart from the usual line mode, users can opt to get VWAP calculations for daily/weekly/monthly in numerical representation
- VWAP Period
- Adjust the default time frame of 14 days to your specified period
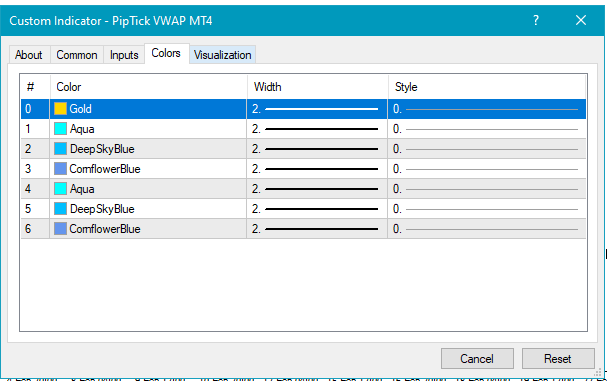
Colors and Style
As seen in the screenshot below, each VWAP has a distinct color and width.
Simply double click on what you want to customize (color, width) then select from the dropdown menu.
How to Add and Delete Additional VWAPs
Deleting PipTick VWAP
To delete, follow the simple guide below:
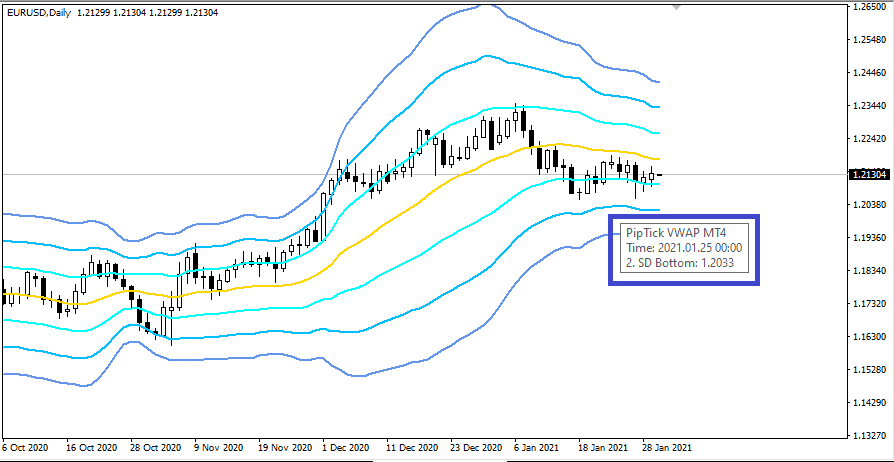
- Hover on the indicator
Tip: make sure the cursor is aligned or directly on the line. To ensure that the cursor is correctly on the VWAP, a label box indicating PipTick VWAP should appear
(See blue box below)
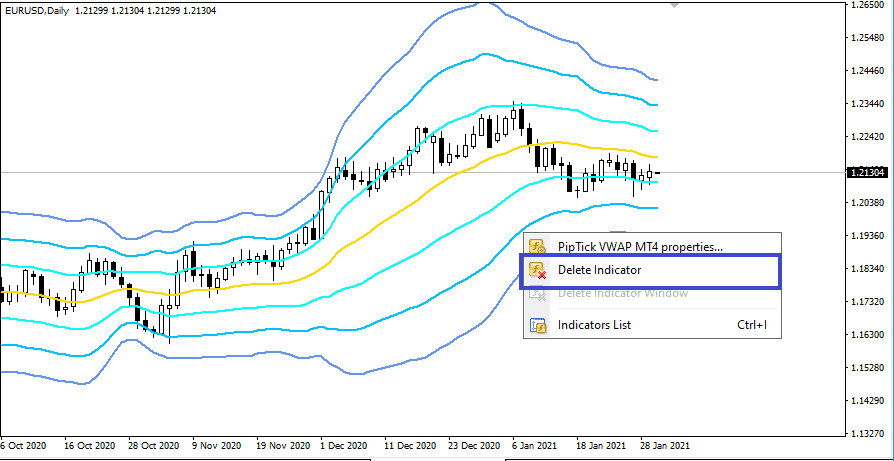
- Select Delete Indicator
See blue box below
Adding an Additional PipTick VWAP
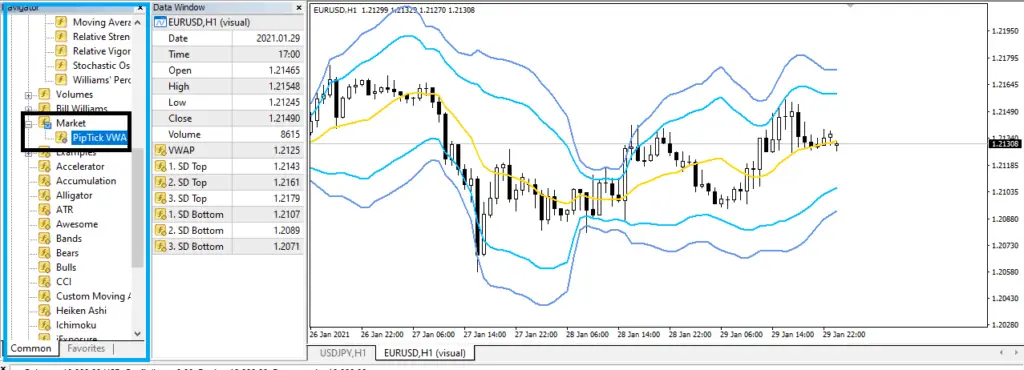
For the easiest way to add another VWAP, use the navigator window:
- Locate the Navigator Window see blue box below
- Locate PipTick VWAP on the list > Double click see black box below
If you cannot locate the indicator on the list, make sure the PipTick VWAP is installed on the platform first. This can either be done through the Strategy Tester or adding the Indicator by copying and pasting the file in the MT4 Data Folder.
- Complete configuration as you would then click OK
The indicator would then be added to your chart
How to get the most out of the indicator
To get the full potential of this indicator, here are some ways to get the most out of PipTick on MT4:
- Purchase or rent
- Downloading the demo version grants users a basic feel of the indicator. However, it is limited in terms of features and usability. One notable limitation is that the demo version can only be used with the Strategy Tester. Through back testing, only historical data is shown on the chart; hence, the indicator cannot be applied to present and live data.
- By purchasing/renting, the users will enjoy the indicator in its full potential without the worries of being subjected to limitations.
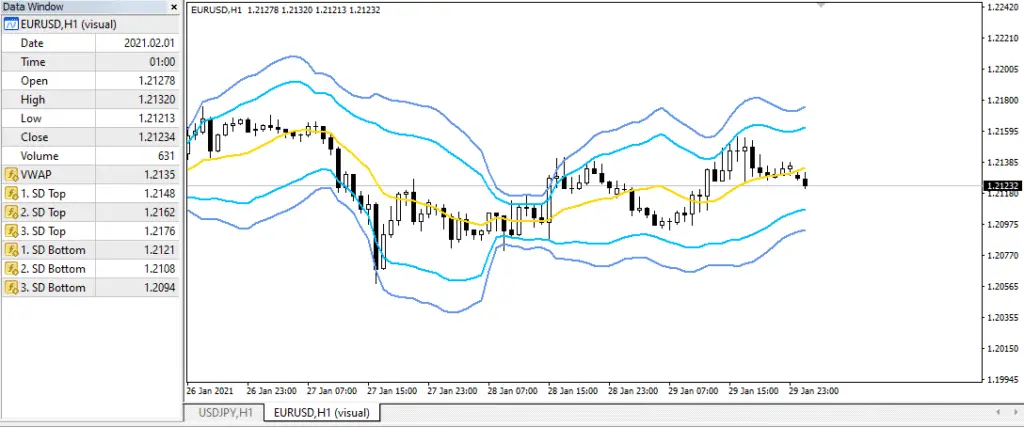
- Use the indicator in conjunction with the data window
- The data window displays the numerical representation of the VWAP variables in tabular form. This gives users an alternative to chart reading.
- By hovering at a specific area in the chart, the data window will automatically update and show actual values of the specific bar.
- Enable the standard deviation channel
- One of the core features that makes the PipTick impressive is its standard deviation channel. Enabling this feature will give users more than just the VWAP value but also give “standard deviation” values that make up a channel/band.
Best VWAP Indicator MT5
VWAP Indicator MT5 MQL5 Custom Indicator Overview
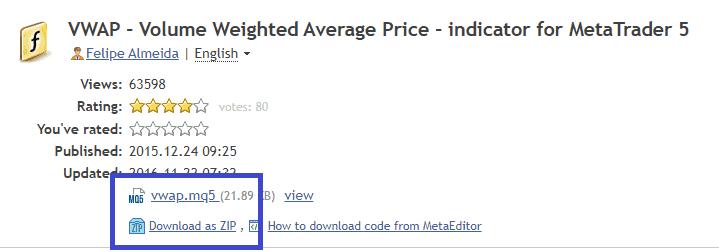
Published in 2015 by Felipe Almedia, the VWAP Custom Indicator for MT5 shows an intraday calculation of the VWAP with an added option of 6 more lines – the period of which is up to the discretion of the user.
This free indicator has had a total of 8 updates. However, the latest update was back in late 2016.
Features
Free and Easy to Use
The VWAP indicator for MT5 is free. On top of this, the indicator is very easy to manipulate, configure, and interpret.
Multiple VWAP Lines
By default, the Daily VWAP line is the sole enabled function. However, users can add up to 5 more independent lines to their discretion. The period for the additional lines can be manually configured to the user’s desire.
Various Price Types
Included in the input parameters is a selection of price types that the indicator will use as the basis for the VWAP calculation. This goes beyond the staple closing price variety as it includes a combination of close-high-low to more complex combinations like open-close-high-low.
Pros and Cons
| Pros |
- Free download for MT5.
- Multiple independent lines to depict various periods of VWAP calculations.
- Various price types.
- Very easy to set up and configure.
| Cons |
- Not available in MT4.
- Might be simplistic for traders seeking advanced features (e.g., PipTick’s standard deviation, alert functions).
How to Setup and Use VWAP Indicator MT5
How to Find the Indicator
To kick things off, download the VWAP indicator mt5. You can either select the MQ5 file or the Zip file see blue box below
How to Add VWAP Indicator MT5 to Chart
Because the VWAP indicator is downloaded from the market, the custom indicator has to be installed to the platform first before it can be added to the chart. This can be done by adding the indicator to the custom list. Follow the steps below:
Step 1: Locate and copy the VWAP MQL5 file on your computer
Step 2: Launch the MT5 platform
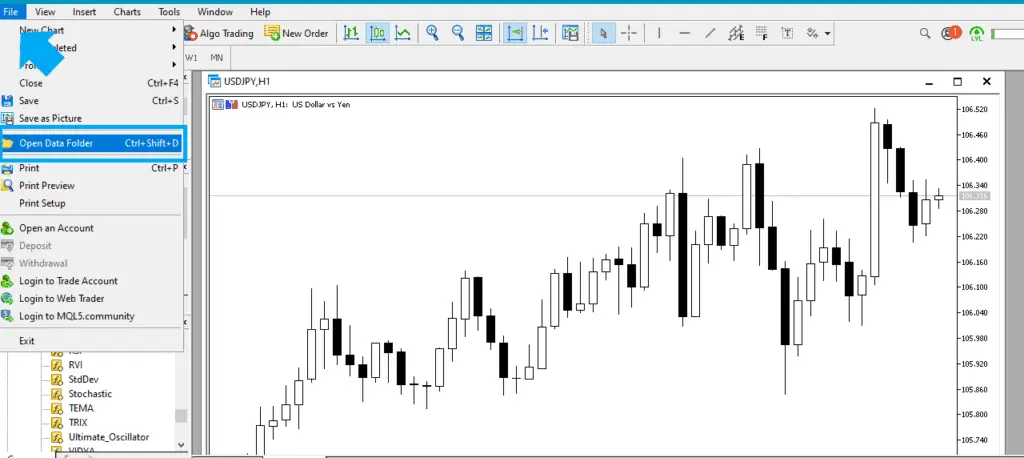
Step 3: Click File (see blue arrow below) on the main toolbar > Open Data Folder see blue box below
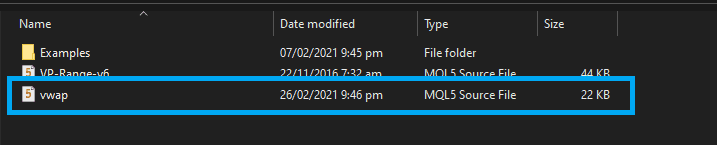
Step 4: From the popped-out folder, click on MQL5 > select Indicators
Step 5: Paste the copied file of your downloaded VWAP indicator. The indicator file should appear. See blue box for sample of a successful upload on the MQL5 folder
Step 6: Close the folder and platform then restart the software
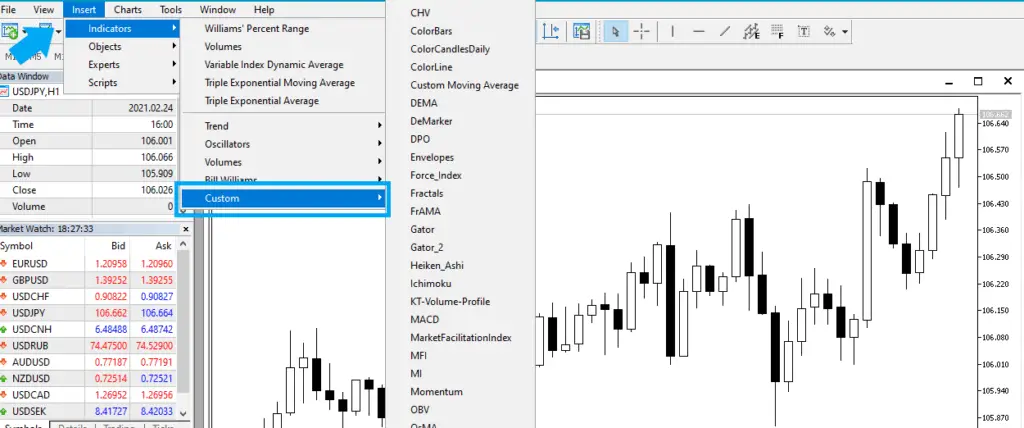
Step 7: Click Insert (see blue arrow below > Indicators > Custom (see blue box below) > VWAP
This will open a window where users can configure settings – you may opt to accept default settings then modify it later. This will then add the indicator to the chart
Basic Settings: Default Input Parameters
The specific parameters in the Input tab will greatly vary per user.
For basic practice, the inputs are filled in by default. Here are the enabled inputs and their respective default configurations: see blue box below
- Price Type
- Select the price type you would like to use as the input for the calculation
- Select from the following:
- Open
- Close
- High
- Low
- Open-Close
- High-Low
- Close-High-Low
- Open-Close- High-Low
- Default selection: Close-High-Low
- Enable Daily
- Enable the daily mode to view the VWAP calculation based on intraday values
- Default selection: true
- Enable Weekly
- Enable the weekly mode to view VWAP calculated for the week
- Default selection: true
- Enable Monthly
- Enable the monthly mode to see the instrument’s VWAP computed for the month
- Default selection: true
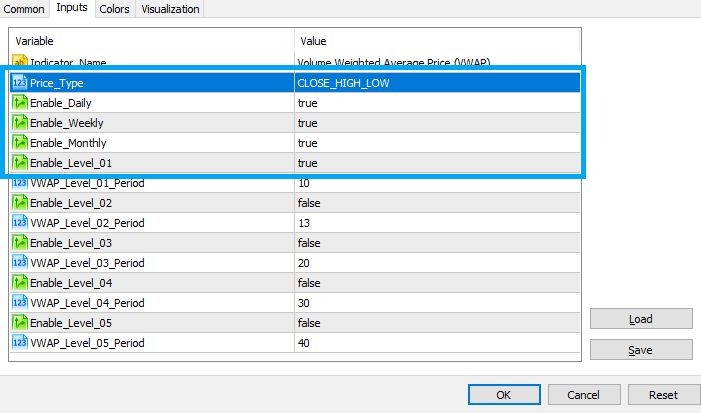
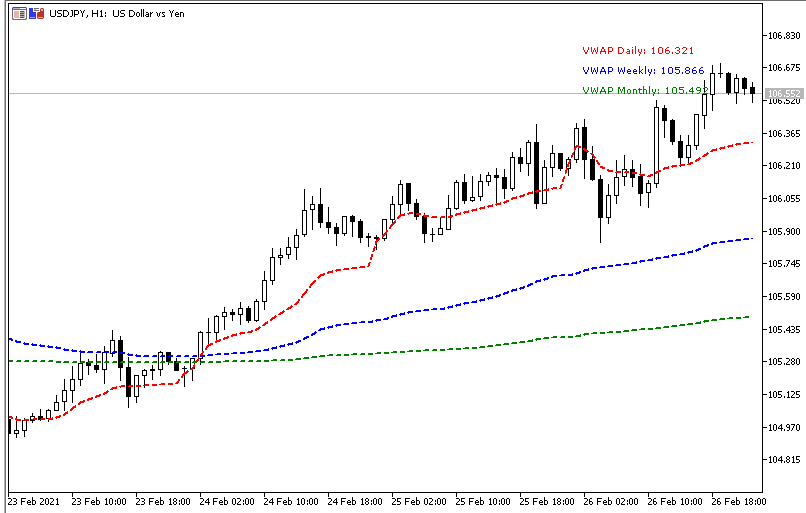
These 4 variables are enabled by default. By accepting these configurations as is, the added indicator will appear like this on the chart:
Customizing Settings: Input Parameters, Colors, and Lines
Inputs
As discussed above the first 4 variables under Input parameters are enabled by default. Users, can still customize those parameters by disabling or modifying the Price Type and/or disable daily/weekly/monthly.
In this subsection, we will explore the other parameter options.
Basically, there are 5 “levels” to which users can custom set a period. By enabling a level, a new VWAP line will appear on the chart on top of 3 basic default lines (daily, weekly, monthly).
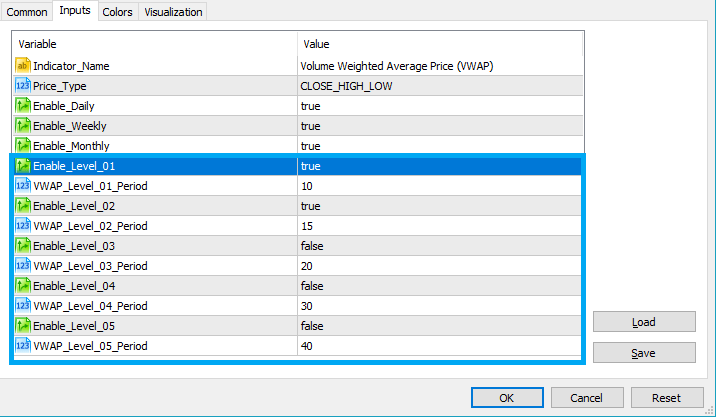
- VWAP Level 1/2/3/4/5 Period
- Set the period by inputting a numerical value
- By setting a period, the algorithm will compute the VWAP for the chosen period. This will appear as a line on the chart
- Enable Level 1/2/3/4/5
- To officially activate the VWAP level, double-click the field to switch to “true”
- Users can enable all set levels or select a chosen few at a time
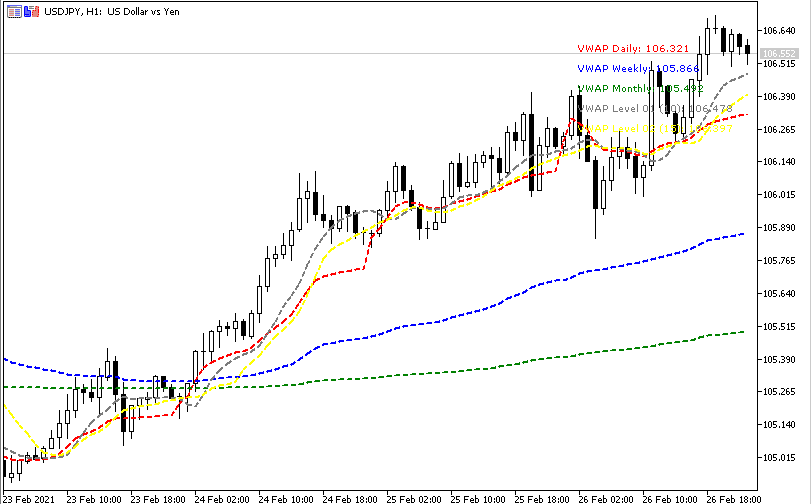
See the example below for activated levels 1 and 2 with periods of 10 and 15.
Colors and Design
The indicator allows personalization in terms of color schemes and line width.
To make design adjustments, go to the Colors tab in the properties window.
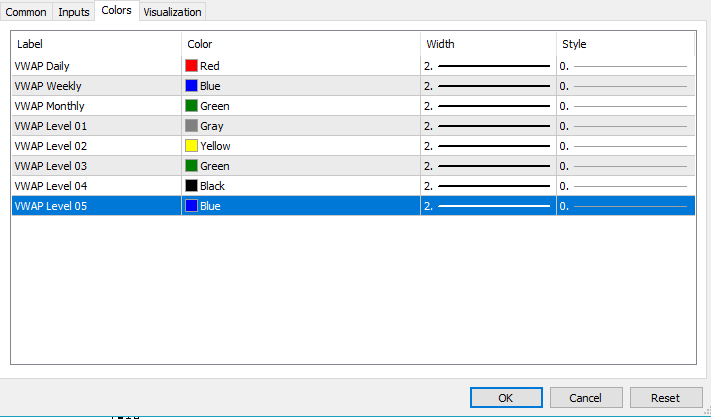
Essentially, each VWAP line will have 3 design options that the user can modify:
- Color
- Wide selection of colors to choose from in painting your lines
- Double-click the field to reveal a drop-down menu of color varieties
- Width
- Change the thickness of the VWAP line by double-clicking the field
How to Add and Delete Additional VWAPs
Deleting VWAP Indicator for MT5
Deleting an active VWAP indicator in MT5 follows the same procedure as deleting in MT4. Follow the simple guide below:
- Hover on the indicator
- Point your mouse on the any of the VWAP lines
Tip: To ensure that the cursor is hovering precisely on the VWAP, a label box indicating VWAP should appear
(See blue box below)
- Right click to reveal drop down menu
- Select Delete Indicator
Adding an Additional VWAP
Also, adding another VWAP is similar to the process on MT4. Again, using the navigator window is a quick way to do this.
- Locate the Navigator Window
Usually, this is located on the left side of the platform. See blue box below
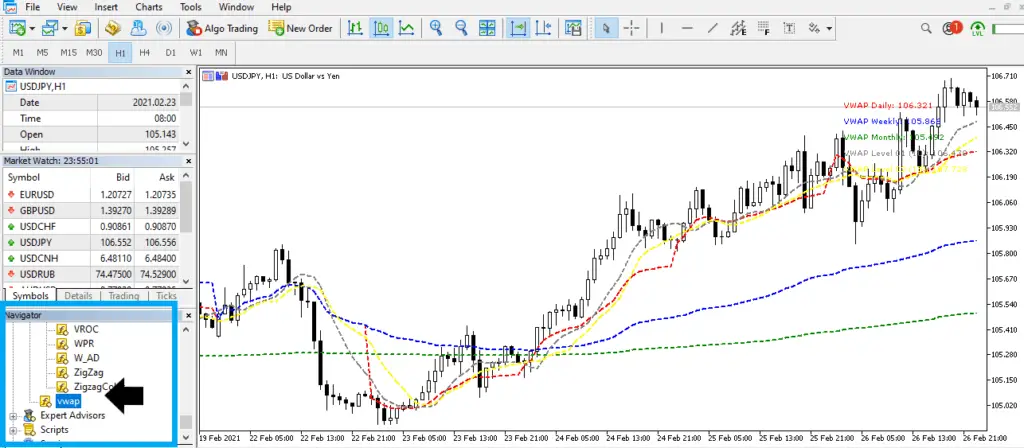
- Locate VWAP on the list > Double-click the indicator
See black arrow on the picture above
The Properties window should appear
Note: If you cannot locate the indicator on the list, make sure the VWAP is installed on the platform first. This can be done by adding the indicator first through copying and pasting the file on the MT5 Data Folder.
- Complete configuration as you would then click OK
The indicator will then be added to your chart
How to get the most out of the indicator
Here are some ways to get the most out of the VWAP indicator for MT5:
- Enable levels
- One way to get the most out of this indicator is to enable the custom period levels
- By default, these are not activated. Users can set the period and not be limited to the default (daily, weekly, monthly)
- Set Price Type to Close-High-Low
- Using the Close-High-Low of a price bar is the common input in VWAP calculation as this gives a good complexion of the key price points in a given day.
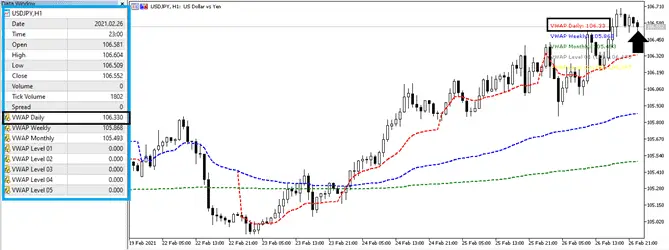
- Use the data window as reference
- Like the PipTick VWAP, the data window is also a good guide that shows the exact numeric figures of the VWAP lines and levels. These figures update automatically as the user hovers across the chart.
- The data window is a clean summary of all the active VWAP lines.
- The illustration above shows the summarized values in the data window (see blue box below)
- As an example, I hovered the cursor at the latest bar (marked by the black arrow).
- Take note of the identical values on the data window and the numerical values on the chart.
- Take advantage of the customization settings
- The VWAP lines, by default, are illustrated in dashed lines. This may not suit the user preferences.