In this post I’ll provide an introduction to the Gann square of 9 calculator. I’ll explain how the calculator works and how to construct your own Gann square of nine calculator.
This is intended as a simple introduction to the topic.
Also, before we get started I would like to point out as a disclaimer that through my research I’ve discovered that most of the information around this topic is dictated by Gann folklore. Therefore, if you are interested in the work of W.D Gann I’d suggest taking a deep dive into his original works. This way I feel like you’d have the best chance of understanding how Gann used his square of nine within his own trading and how to implement it within your own
Who is W.D Gann
William Delbert Gann was a New York and Chicago based trader between 1902 and 1955. During this period he developed, wrote about and taught his methods for forecasting and analyzing markets.
Gann’s methods employed geometry, astrology and ancient mathematics to predict market movements.
He developed a series of Gann indicators that reduced many of the techniques he developed into a simple form that anyone could comprehend and employ.
The extent of Gann’s success using any of these methods remains unclear. However to this day Gann’s legacy of trading strategies and indicators continues to influence investors and short term traders.
Two of Gann’s most well known published books include How to make profits in commodities and 45 years in Wall Street.
What is the Gann square of 9
The Gann square of 9 is a geometric calculator used by Gann for calculating and forecasting significant market turning points.
The square of nine calculator wasn’t invented by Gann. It is simply a geometric calculator that was used before slide rules and other modern day calculators came about.
Gann’s methods however popularized its use to help forecasting market movements. Within trading circles it is now commonly referred to as the ‘Gann square of nine’.
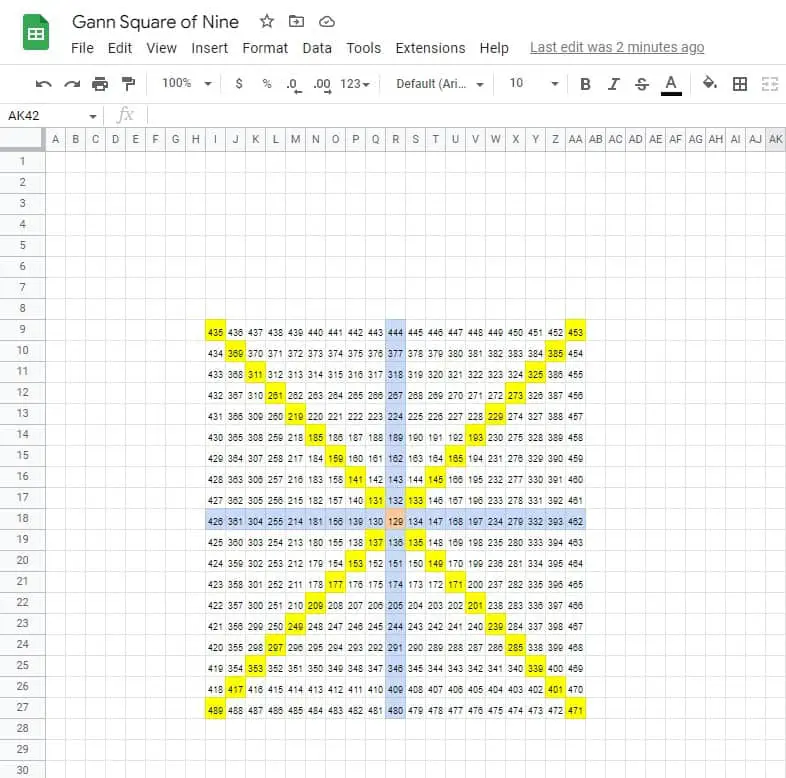
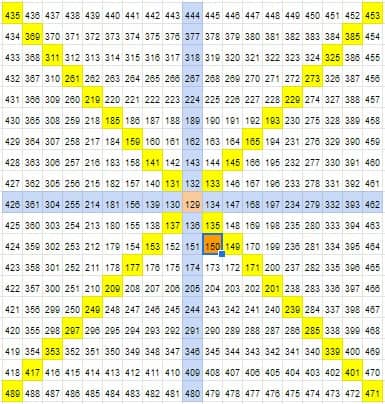
The calculator itself is formed from a series of clockwise (typically, but sometimes anti-clockwise) spiraling numbered cells that originate from a center number (1). The number in each cell increases by 1 as the spiral grows. These numbered cells form a series of concentric squares.
The most important numbers on the Gann square of nine are those located on the cross (cardinal cross-blue) and the diagonals (ordinal cross – yellow). In the calculators simplest form these numbers are used to predict future price movement.
The Gann square of nine calculator also employs geometric forms such as triangles and squares as overlays to project and predict future market events (This is however beyond the scope of this article).
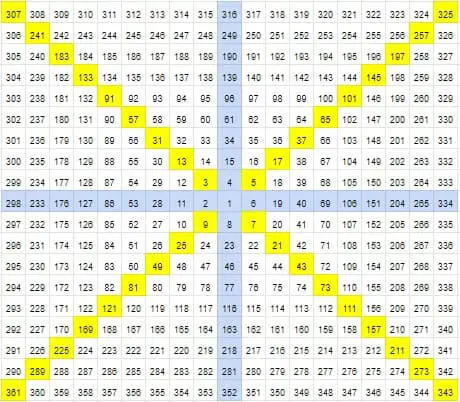
Gann square of nine cardinal cross and ordinal cross
The most important numbers in the Gann square of 9 calculator occur on the cardinal (vertical and horizontal – blue) cross and the ordinal (diagonal – yellow) cross.
According to Gann theory, any number that falls or the cardinal or ordinal cross is a significant level that may act as support or resistance or represent a turning point in the market.
How to use the Gann square of nine
There are numerous methods for employing the Gann square of nine. In fact if your looking to employ the Gann square of nine in any form. I’d suggest developing an in-depth understanding of Gann’s work and methodologies to fully understand when to employ any of the methods.
This articles goal is to simply introduce the topic of the Gann square of nine calculator.
Therefore, for the purposes of this article; I’ll only be detailing the most common and simplest method: Using cell numbers at the cardinal and ordinal cross numbers to identify important support and resistance levels.
The other methodologies that employ the Gann wheel square of nine include geometric overlays as various angles determined by historical pivot points in the market. This is a more detailed topic beyond the scope of this article.
Disclaimer: I’d like to point out that using the calculator alone to predict any form of market movement is likely not going to be successful. Gann’s work and application of his methods are ambiguous at best. The reasoning for his methods talk about the ‘law of vibration’, ‘natural harmony’ and the ‘Zodiac’. So if your goal is employ any of these methods be prepared for a deep dive into his work. This is definitely not a plug and play calculator!
If your interested in exploring the Gann wheel square of nine deeper consider getting your hands on one of Gann’s original books.


Also this book specializes in the topic:

Using Gann square of 9 to predict support and resistance levels
The Gann square of 9 was typically used to forecast turning points in the market. Gann used the calculator to forecast support and resistance price levels.
The most basic application of the calculator is by using the Cardinal cross and ordinal cross to predict these important levels.
The following instructions are intended for introductory educational purposes only (read disclaimer above and general website disclaimer).
The Gann square of 9 calculator may forecast support and resistance levels by using the cardinal and ordinal cross by following these steps:
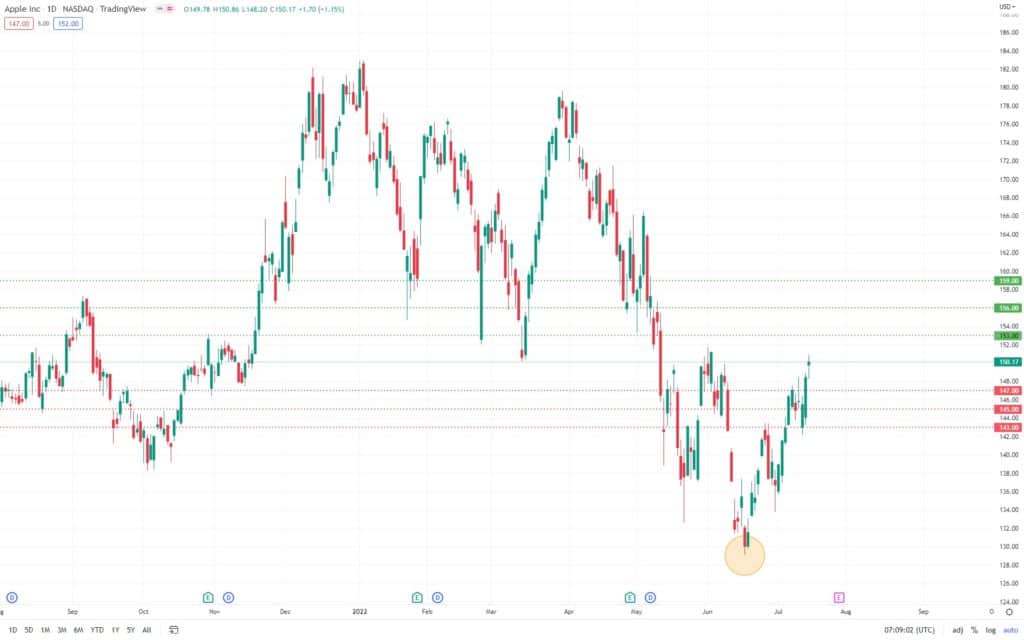
- On the market candlestick chart select the lowest most relevant pivot point.
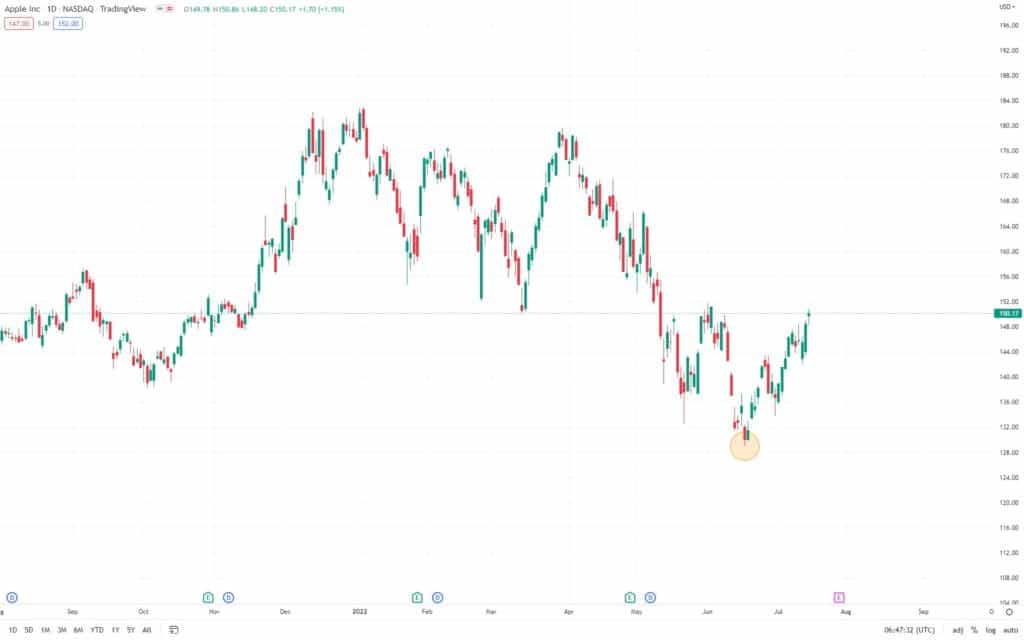
- Enter this price value into the center square of the Gann square of 9 calculator.
- Take note of the current price and highlight it on the calculator
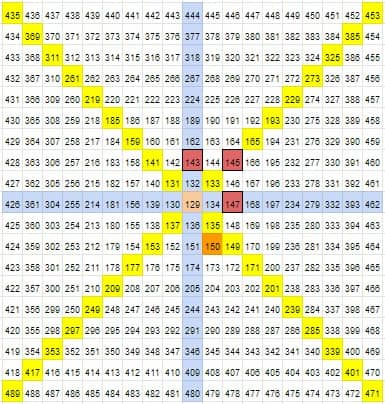
- Locate the resistance levels – To do this rotate clockwise from the current price (prices increasing). Locate the price values on the cardinal cross and ordinal cross. Ignoring the price value closest to the current price. These values are the forecasted resistance levels by the calculator. The price values on the ordinal cross are typically considered more valid that the cardinal cross.
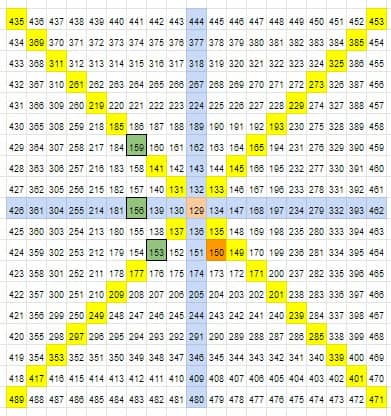
- Locate the support levels – To do this rotate anti-clockwise from the current price (prices decreasing). Locate the price values on the cardinal cross and ordinal cross. Ignoring the price value closest to the current price. These values are the forecasted resistance levels by the calculator. The price values on the ordinal cross are typically considered more valid that the cardinal cross.
Gann square of 9 calculator | Gann Square 9 Calculator free download for PC
One of the best free Gann square of nine calculators is the Gannzilla Pro a downloadable Gann square of 9 calculator.
This is a stand alone program that has loads of options available to play around with.
How to create a Gann square of nine calculator in excel or google sheets
If your looking for Gann square of 9 calculator. Then consider building your own in excel or google sheets.
Building a Gann square if nine calculator in excel is simple and quick to do. The following explains step by step how to build your own Gann square of nine calculator in excel or google sheets:
The following is done in google sheets but doing the same in excel is similar.
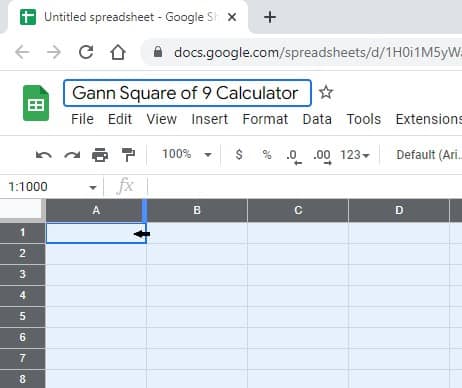
- Open a new spreadsheet
- Resize the cells to make them all square. To do this in google sheets select all cells by selecting the most upper left cell. Then hover over the ‘A’ cell right boarder till a small arrow appears. Click and drag the cursor to resize the cells to squares.
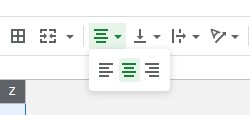
- With all cells still highlighted go to the ‘align text’ function and center all text.
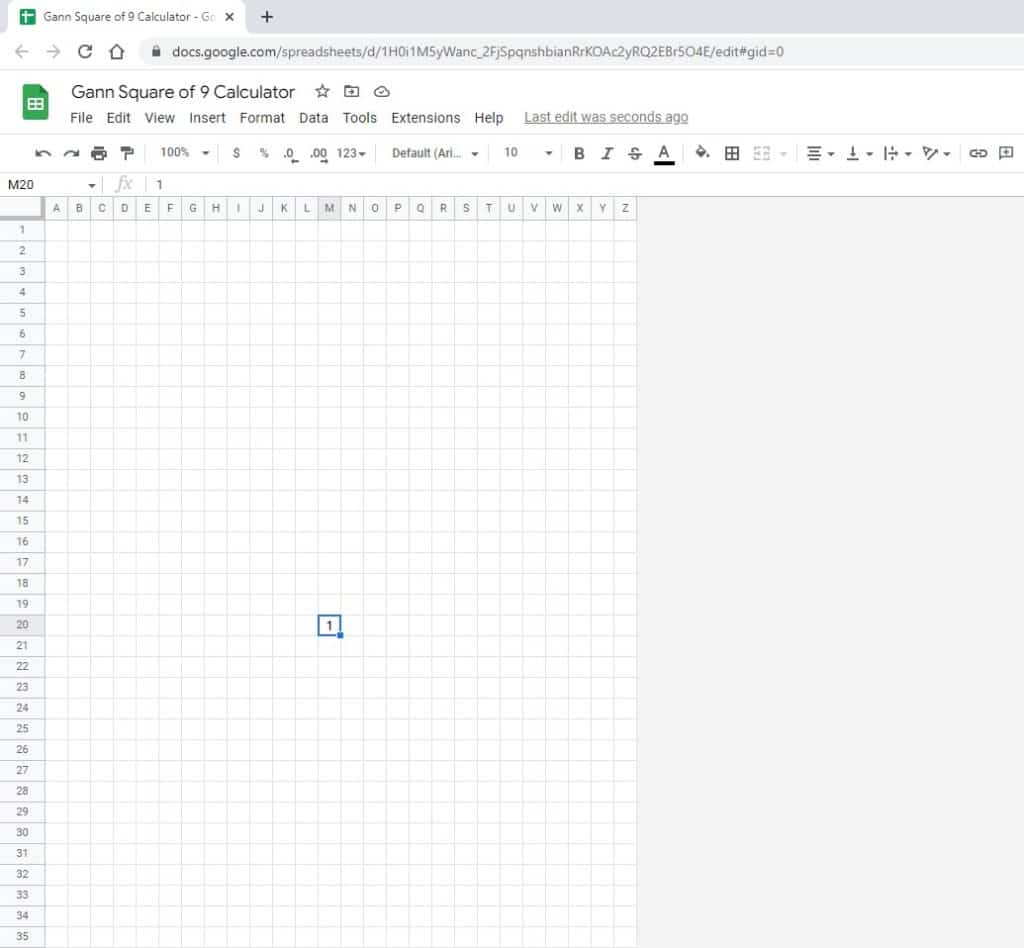
- At least 12 cells from the left and top of the spreadsheet enter a ‘1’ into a cell.
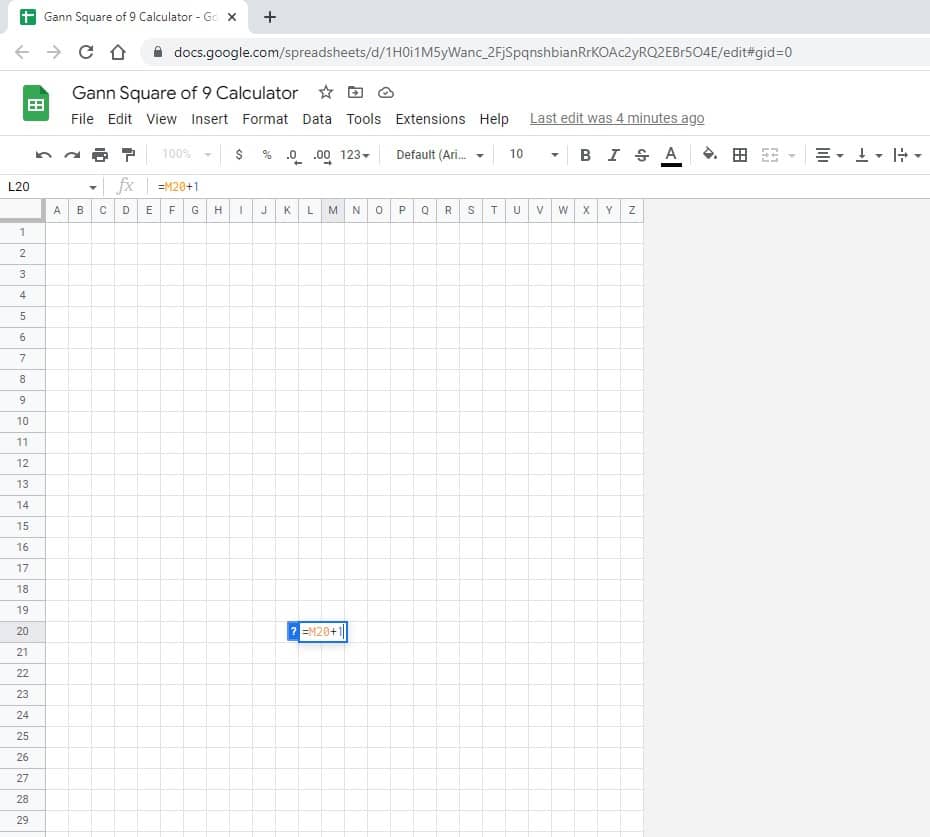
- In the cell immediately to the left enter the formula (=’Previous cell’+1) in my case that’s =M20+1
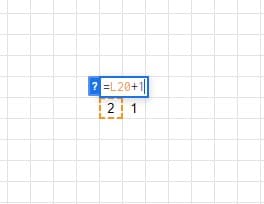
- Next, above the previous cell enter the formula again (=’Cell below’+1) in my case that’s =L20+1
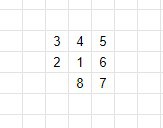
- Continue this process all the way around till you get to ‘8’. It should look like the following:
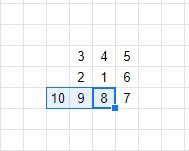
- Next drag the formula from the 8th cell 2 cells to the left.
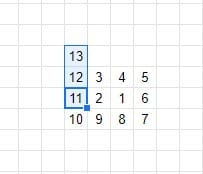
- Add the 11th cell enter the formula (=’Cell below’+1). Then drag this 11th cell 3 cells up past the next corner.
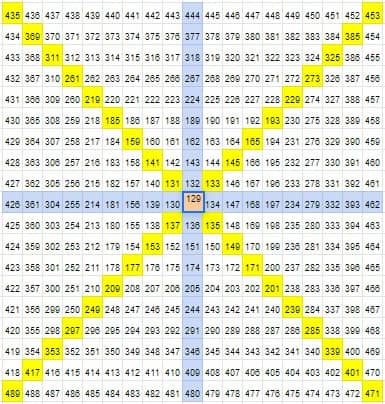
- Continue this process spiraling around the existing numbers to build out the calculator. You will find the once you have turned one square past the corner you will be able to drag the formula across to the opposite corner making the process easier as the calculator builds out. Build the calculator out to you reach the number 489.
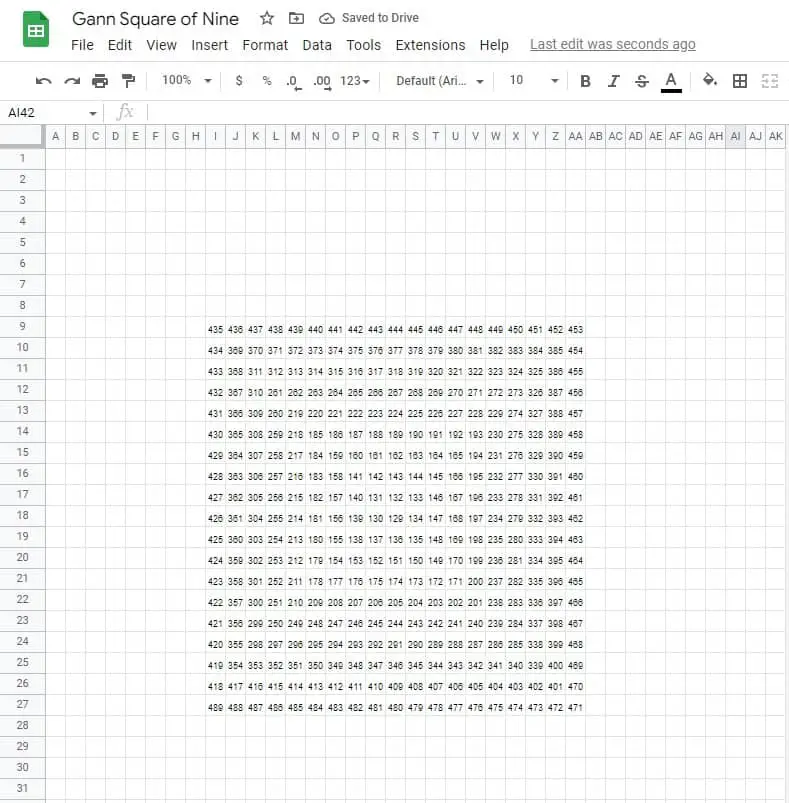
- Highlight the vertical, horizontal and diagonal axis as shown