If your interested in in using the the Tradingview heatmap feature. Or simply want to find out more about the Tradingview heatmap or heatmaps in general. Then this post provides a complete overview and guide to the Heatmap Tradingview feature.
In this post I’ll explain what is a heatmap in Tradingview and explain step by step how to use the heatmap in Tradingview.
Signup for a Essential, Plus+ or Premium TradingView subscription using the link. *New users get $15 towards a new plan.
What is a Heatmap?
In data analysis a heatmap in general is a visual display tool for visually displaying density or volume of some data variable.
Heatmaps typically use a matrix of fixed or varying sized cells that are color graded to describe varying degrees of data density.
Typically heatmaps are categorized as either a cluster heatmap or spatial heatmap. Typically a cluster heatmap is laid out as a matrix of arbitrary sized cells in rows and columns. A spatial heatmap cells are determined by the size of a nominated space – An area on a map for example.
Does TradingView have a heatmap?
Yes, Tradingview does have a heatmap feature.
Tradingview has a platform integrated variation of a cluster heatmap.
The heatmap in Tradingview visually display and compare one or two variables using color grading and / or cell size. I’ll discuss these variations in the next section.
To date there is the option to select either a heatmap to display Stocks or Cyptocurriencies.
There is also the option to use filters and various other options to customize the heatmap to your preference. I will discuss all of this option in the ‘How to use the heatmap in Tradingview – Step by step guide’ section below.
Remember, If you are interested in using Tradingview heatmaps and want to integrate them into your trading. A great way to get the most out of the platform is to upgrade to a Essential, Plus or Premium subscription.
Signup for a Essential, Plus+ or Premium TradingView subscription using the link. *New users get $15 towards a new plan.
What is a heatmap in TradingView?
The Tradingview heatmap is a VARIATION of a cluster heatmap (see the ‘What is a heatmap’ section above for more detail about cluster versus spatial heat maps).
The Tradingview heatmap is a matrix of color graded cells of the same or varying cell sizes (depending on whether a second variable wants to be displayed).
The Tradingview heatmap can be used to visually display, visually compare and visually analyze a group of Stocks or Cryptocurrencies.
The Tradingview heatmap can display either one or two selectable variables that determine the cell color and cell size:
Cell Color can be used to display performance variable such as percentage performance over various timeframes (1h, 4h, 1D, 1W, 1M, 3M, 6M, YTD, Y), Pre-market change percentage, post market percentage change, relative volume, volatility percentage and gap percentage.
The heatmap in Tradingview utilizes a series of color graded cells to describe the percentage magnitude of the change in the selected variable.
The color red represents a percentage loss, green a percentage gain and grey is no price change (within a percentage threshold of 0.5 percent loss or gain). The shade of red or green colors represents the magnitude of the price loss or gain. see image below:

Cell size (optional) can be used to visualize either trading volumes, market cap, dividend yield, number of employees, price to earning ratio, price to sales and price to book.
The size of each cell represents the magnitude of each of these variables.
Why use the Tradingview heatmap?
Heatmaps in trading are becoming increasingly popular as a method of visually screening and comparing markets groups.
The Tradingview heatmap is quick and easy method for seeing the biggest market movers, biggest gapping stocks or highest volume of stock being traded.
The heatmap offers a quick and ball park type of analysis that can be used as an initial birds eye view of the market. It offers a clean, uncluttered and simple method for analyzing markets as a whole.
Having the heatmap built into the Tradingview platform allows the tool to be easily integrated with other Tradingview screening tools and charting features.
Signup for a Essential, Plus+ or Premium TradingView subscription using the link. *New users get $15 towards a new plan.
How to use the heatmap in Tradingview – Step by step guide
The heatmap feature in Tradingview is available for Stock and Cryptocurrency analysis.
To find the heatmap feature in Tradingview go to ‘Products’ in the Tradingview home page top menu bar.
Select ‘Heatmaps’ then either ‘Stock’ or ‘Crypto’.
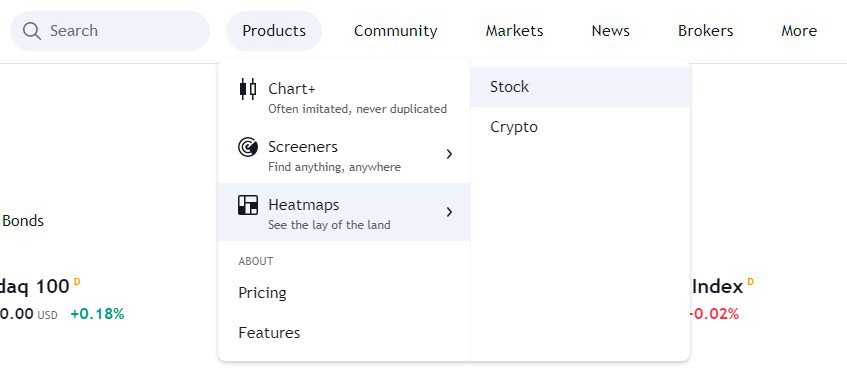
The heatmap will display:
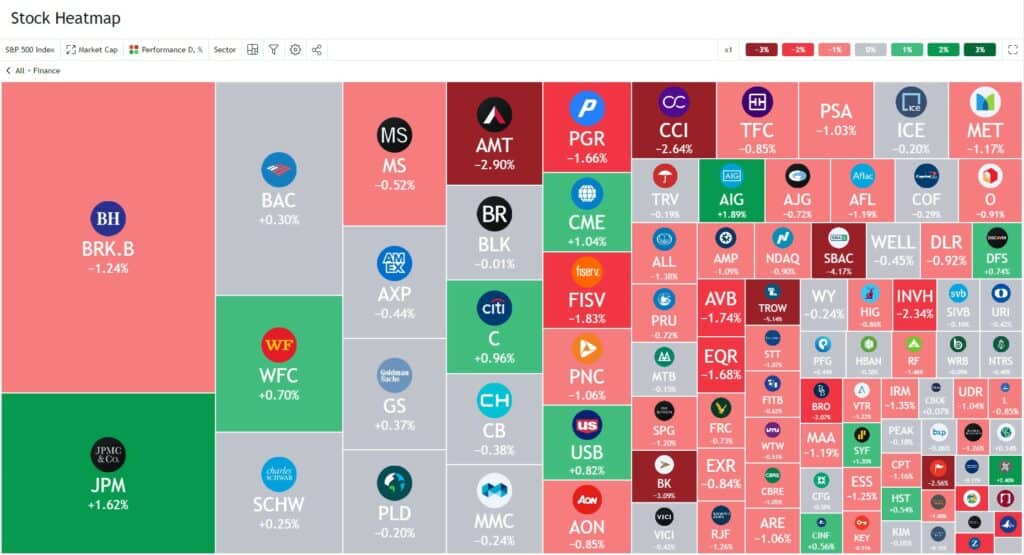
Tradingview Stocks Heatmap
To customize your heatmap use the selections in the menu bar directly above the heatmap matrix:

Select source
In the far left of the menu bar is the option to ‘Select Source’. This relates to which major market you want to display stocks. This includes all the major stock markets in the US and around the world. By default S&P 500 is selected.
Cell Size
The next menu item is to categorize ‘by size’. This option lists a series of variable selections to determine the size of each matrix cell. Options include: Trading volumes, market cap, dividend yield, number of employees, price to earning ratio, price to sales and price to book.
Cell Color
To select which variable to determine cell color select the ‘by color’ menu option. Matrix cells will be color graded depending on the variable selected.
Options include: Percentage performance (1h, 4h, 1D, 1W, 1M, 3M, 6M, YTD, Y), Pre-market percentage change, post market percentage change, relative volume, volatility percentage and gap percentage.
Sector
By default the stocks heatmap is divided into sectors: These include technology Services, Finance, retail Trade, Energy Minerals etc.
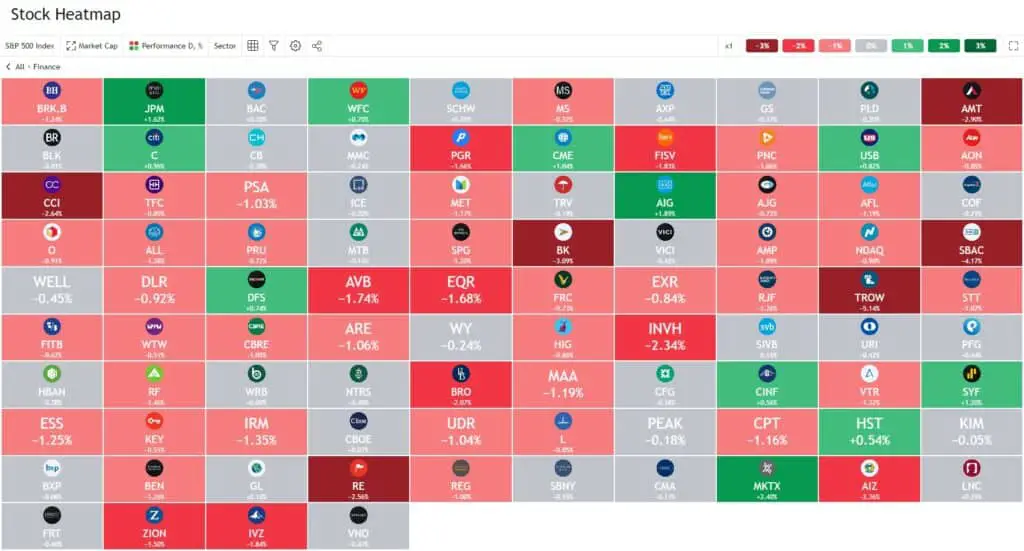
If you prefer to see the whole of the market you’ve selected choose ‘No Group’.
Toggle mono size
To select between variable and same size cells select either the ‘Toggle mono size’ option. Here you can toggle between mono size cells or varying sized cells. The mono size cells selection will order the cell by the size size variable selection left to right starting with the top row.
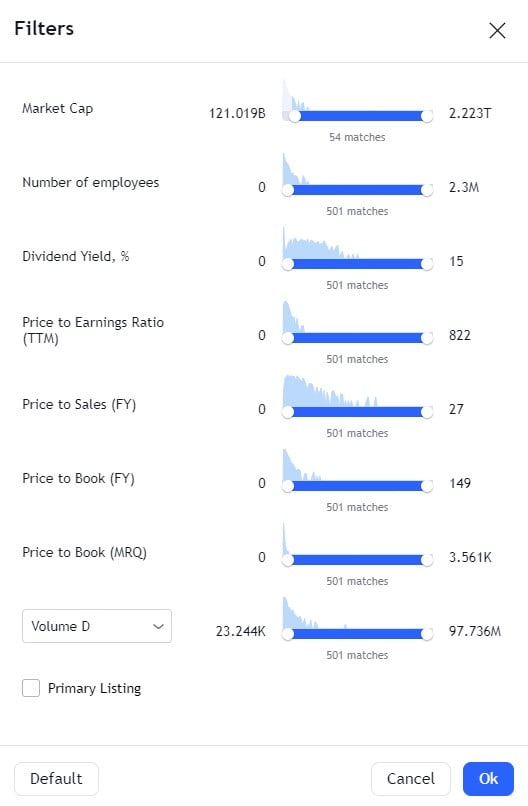
Filters
Here you can filter the heatmap display based on a handful of variables.
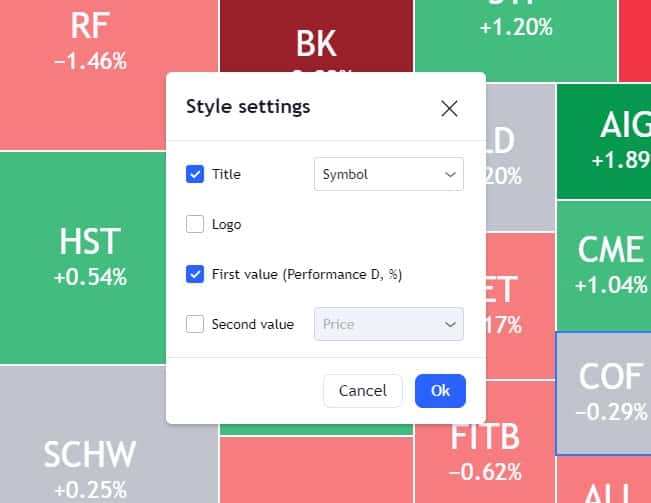
Settings
Under settings there are options to select what information is displayed in each of the cells.
Share
The share option allows you to save the heat map as an image, copy the link to the heatmap to share, and or share via twitter or facebook.
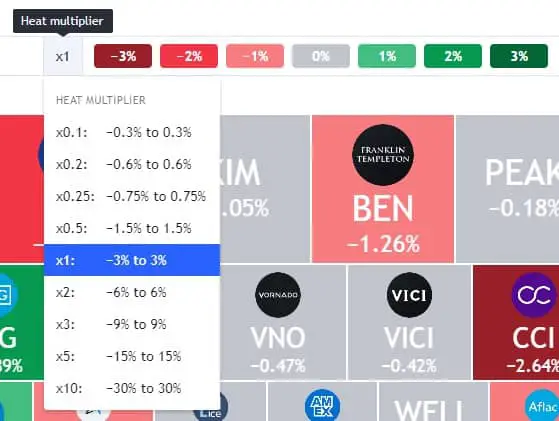
Heat Multiplier
The heat multiplier option allows you to adjust the thresholds of each the color grades for each of the cells. By default this is set to -3% to +3%. This generally seems to offer the best color variation in typical market conditions. But if markets are more (or less) volatile might prefer a bigger or smaller heat multiplier.
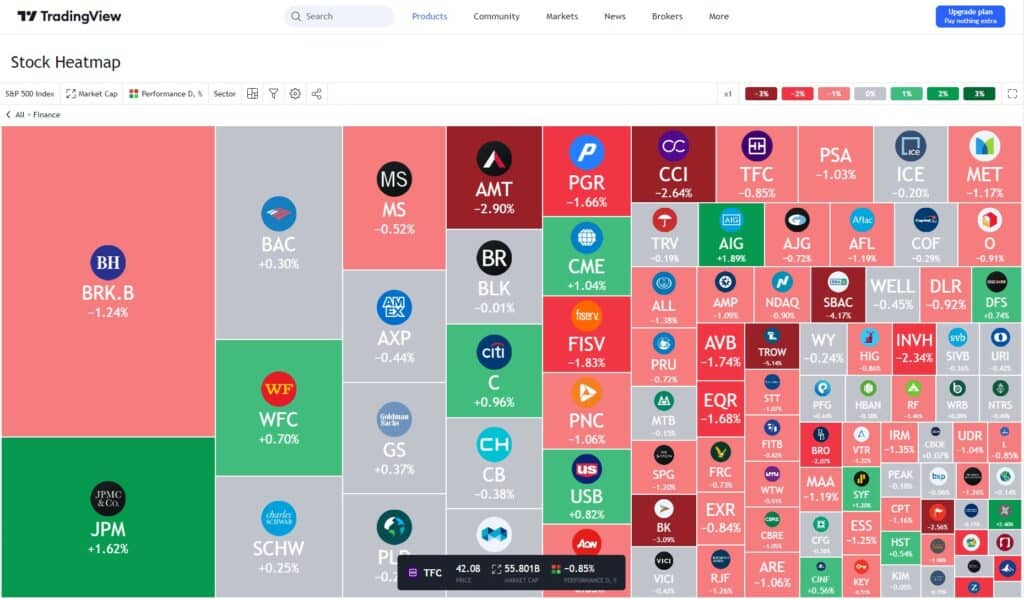
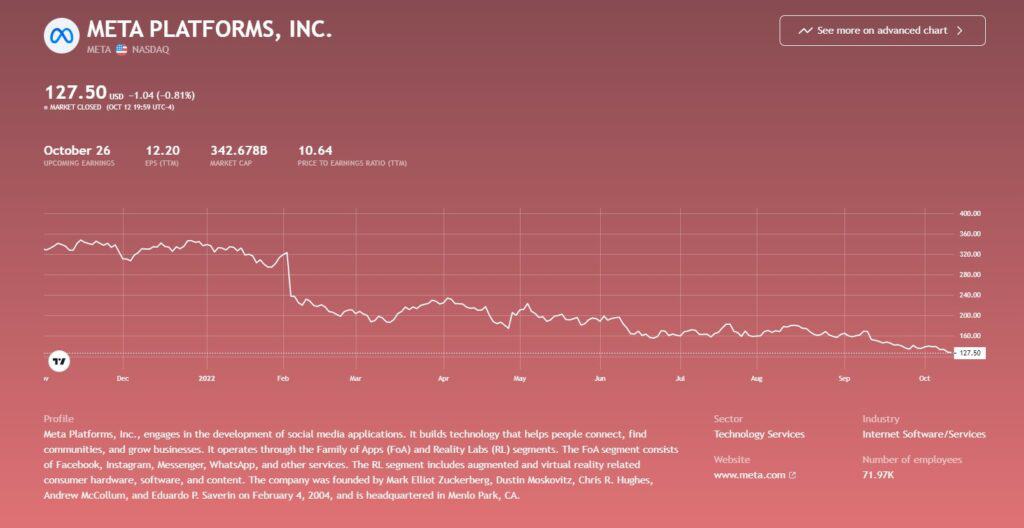
Matrix cell Stock / Coin summaries
A really nice usability feature of the heatmap interface is all cells within the matrix are linked to a stock / crypto summary that includes a chart of recent performance plus an overview of the company / coin.
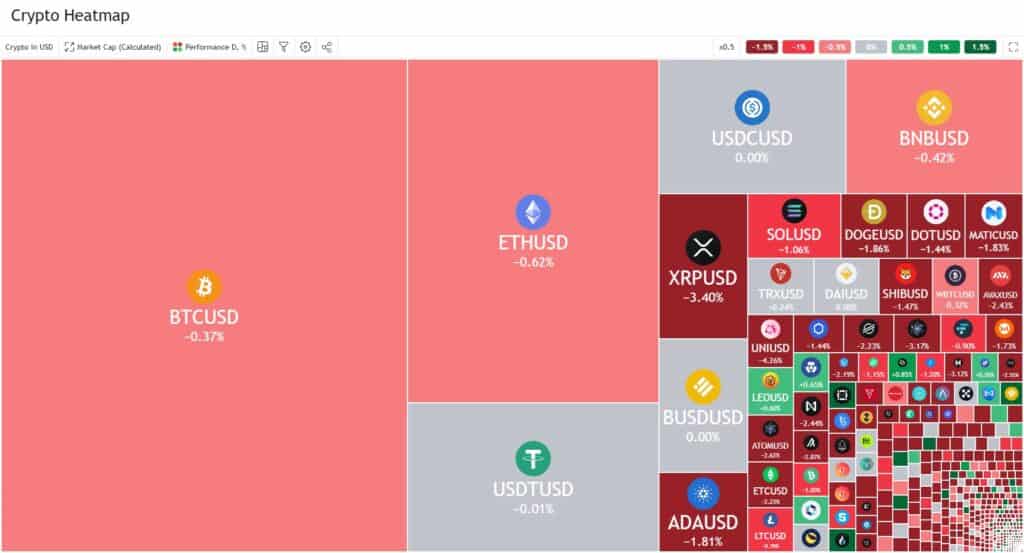
Tradingview Crypto Heatmap
Tradingview Crypto heatmap is similar in principle to the Stock heatmap. The major variations include no ‘Sector’ option, there are fewer options for the cell size and cell color variables and the source selections relate to the crypto markets. All other menu options remain the same.
Signup for a Essential, Plus+ or Premium TradingView subscription using the link. *New users get $15 towards a new plan.