In this post I’ll compare two popular online web browser based charting trading platforms on the market today: TradingView vs StockCharts.
In this comparison review I’ll discuss the key functionalities and features of each platform. I’ll compare in detail how to get started with each platform, platform tools, fees, brokerage support, Interface design, learn curve and more. I’ll offer my opinion on what platform preforms best in each category and at the end of the article offer my overall opinion on which platform performs best in this TradingView vs Stockcharts comparison review.
TradingView and StockCharts Key Features
In this first section I’ve created a side by side table comparison of each platforms key features:
System Requirements
Because both platforms are web browser based, TradingView and StockCharts have only basic system requirements. Making both platforms accessible to any user with a stable internet connection. Both platforms are supported by most modern internet browsers.
| TradingView | StockCharts | |
|---|---|---|
| Web Browser Based | ✓ | ✓ |
| Mobile App | ✓ | ✗ |
| Downloadable Software | ✗ | ✗ |
Interface and Chart Design
TradingView and StockCharts offer a modern design that both are intuitive to use.
| TradingView | StockCharts | |
|---|---|---|
| User Interface Design and Usability | Modern, Smart and highly intuitive. Dashboard displays all relevant panels (Watchlist, News, Market Summary. | Simple and Professional. StockCharts has a well-organized interface. Modern feel. |
| Charting Experience | Smooth and easy to use Charts are powered by HTML 5 – a highly intuitive and user-friendly charting. | Interactive and Complete. Sharp Chart is StockChart.com’s home-grown charting program that is generally easy to use. The charting experience has a larger learning curve than TradingView. Some crucial features require a paid subscription to access. |
Subscription Options and Pricing
TradingView and StockCharts have a good selection of plan types. Offering plenty of options to find an account that suits your budget and preferences.
| TradingView | StockCharts | |
|---|---|---|
| Free | ✓ Free web-based access | ✓ Free web-based access |
| Subscription Options | 4-tiered monthly / Annual subscriptions. Monthly options: Basic (Free), Essentail ($12.95), Plus ($24.95), Premium ($49.95). Annual rates also available. See fees section below for more details. | 4-tiered monthly subscription options: Free. Basic ($14.95), Extra ($24.95), PRO ($39.95). See fees section below for more details |
Signup for a Essential, Plus+ or Premium TradingView subscription using the link. *New users get $15 towards a new plan.
Supported Markets
Both TradingView and StockCharts supports a good variety of asset classes.
| TradingView | StockCharts | |
|---|---|---|
| Forex/Currencies | ✓ | ✓ |
| Stocks/Equity/Index | ✓ | ✓ |
| Futures | ✓ | ✓ (Free data – only end of day) |
| Cryptocurrency | ✓ | ✓ |
Real Time/Official Data Plans
| TradingView | StockCharts | |
|---|---|---|
| Data Plans | Data packages for global exchanges with Upgraded plans for additional fee | Official data plans – $9.95/mo US, UK, Canada, India |
| Free Real Time Data | BATS or CBOE real-time data for US region; delayed for all other exchanges | BATS or CBOE real-time data for US region; delayed for all other exchanges |
Indicator Library and Access
Both TradingView and Stockcharts have good selection of built-in and add-on/custom indicators.
| TradingView | StockCharts | |
|---|---|---|
| Built-in Indicators | 100+ built-in technical indicators | 70+ built-in technical indicators |
| Third party Indicators | 5,000+ Third party custom indicators | Custom indicators are NOT widely available for StockCharts. |
| Programming Language | Pine Script Native language of TradingView. Easy to use coding language | – |
TradingView and StockCharts: Pros and Cons
In this section, we will compare each platform in a little more detail by comparing several categories. I like to offer my opinion of which platform I think performs best in each.
Getting Started and Setup
Since both platforms are web browser based setting up is pretty much as simple as opening a web browser, navigating to each website and signing up. These two platforms only need a modern PC and web browser. The platforms both run lite so as long as your computer is no more than 5-7 years old you should be fine.
To get started with either TradingView or StockCharts click the links.
Signup for a Essential, Plus+ or Premium TradingView subscription using the link. *New users get $15 towards a new plan.
Getting started does not require any complex installation or setups for either platform. Instead, users only need to register for an account, whether free or paid, to start using the platform. Notably, both TradingView and StockCharts have a 30-day free trial for their paid subscriptions.
StockCharts has a very helpful “get started” feature in its application process where it provides new users with chart templates and suggested screeners.
Winner: TradingView/StockCharts. Getting started and setup with either platform is simple and the process for each is more or less identical. Getting signed up is quick and easy. Both offer a 30-day free trial. Some users may appreciate the getting started feature that StockCharts offers after sign up.
Software vs Online Access
Both TradingView and StockCharts are web browser based, neither require any software installation.
TradingView offers native mobile application whereas StockCharts has only optimized some of its features to fit a mobile browser. One of the drawbacks of running StockCharts is that some of its complex tools (like ChartNotes its annotation tool) aren’t well-suited to the smaller mobile version displays.
Winner: TradingView. TradingView offers a dedicated mobile application platform. Meanwhile, StockCharts doesn’t have a mobile app, it only runs via mobile web browser.
Costs
Both platforms offer good value subscription packages and excellent free plans for basic charting needs. Choosing between the higher subscription plans depends on the features you require.
The following table offers a quick comparison of some major variations between similarly priced subscriptions:
| TradingView | StockCharts |
| Essential ($12.95/mo): 5 indicators per chart. Ad-free. 2 charts in 1 window. 10 alerts | Basic ($14.95/mo): 50 indicators per chart (25 overlays, 25 indicators). Ad-free. Multi-chart layouts. No alerts |
| Plus ($29.95/mo): 10 indicators per chart. 10 saved chart layouts. 4 charts in 1 window. 30 alerts | Extra ($24.95/mo): 50 indicators per chart (25 overlays, 25 indicators). ChartLists* 250 lists. 10 technical alerts |
| Premium (49.95/mo): 25 indicators per chart. Unlimited saved chart layouts. 8 charts in 1 window. 400 alerts | Pro ($39.95/mo): 50 indicators per chart (25 overlays, 25 indicators). ChartLists* 350 lists. 100 technical alerts |
*ChartLists are “online folders” that can store up to 500 charts in one folder/group. Quite similar to TradingView’s saved charts.
Winner: TradingView/StockCharts. There is little significant price difference between each of these platforms except at the highest tier plans. Both platforms represent excellent value for money. Ultimately your choice of plan comes down to the features you require. From a purely cost comparison basis StockCharts appears to offer better value for those interested in the highest tier plans. But if the Basic plans suit your needs there is little cost benefit going with one over the other.
Broker Support
TradingView certainly has a more extensive network of supported brokers that cater to different asset types like Futures, Stocks, Forex and Crypto. The list includes popular brokers TradeStation, OANDA, FXCM, Gemini (crypto), among others.
StockCharts only has one broker-partner Tradier Brokerage. A notable advantage is that Tradier is commission free for equities trading and offers unlimited options trading at a flat rate – avoiding the hassle of per-contract fees.
Winner: TradingView. TradingView’s Broker network that encompasses multiple asset classes is a huge advantage for traders that trade more than one asset class or that have active brokerage accounts with one of the supported brokers.
Charting Tools
TradingView offers about 50 drawing tools that can be used for free. The TradingView interface and tool bars make finding and using these tools generally very easy. They are initiative, look great, are clear and can be easily customized.
StockCharts has an excellent library of charting tools accessible via the ChartNotes annotation platform. The toolkit offers an excellent suite of tools that includes the most popular charting tools like trendlines, channels, and Fibonacci retracements. However, a notable disadvantage is that saving annotations requires a paid subscription.
Winner: TradingView. ChartNotes annotation tool isn’t as initiative and easy to use as the TradingView tools. Most disappointing, the annotations with StockCharts require a paid subscription. Whilst TradingView provides up to 50 drawing tools for free that can be saved to any chart.
Charting Experience and Interface Design
StockCharts’ official technical chart SharpCharts is one of the most used features on the platform. Users can use this in conjunction with the SharpCharts Workbench where a handful of the technical overlays and indicators are located. Users can also access the new interactive full-screen, real-time streaming StockChartsACP as well as CandleGlance, PerfCharts. Learn more about these charts here.
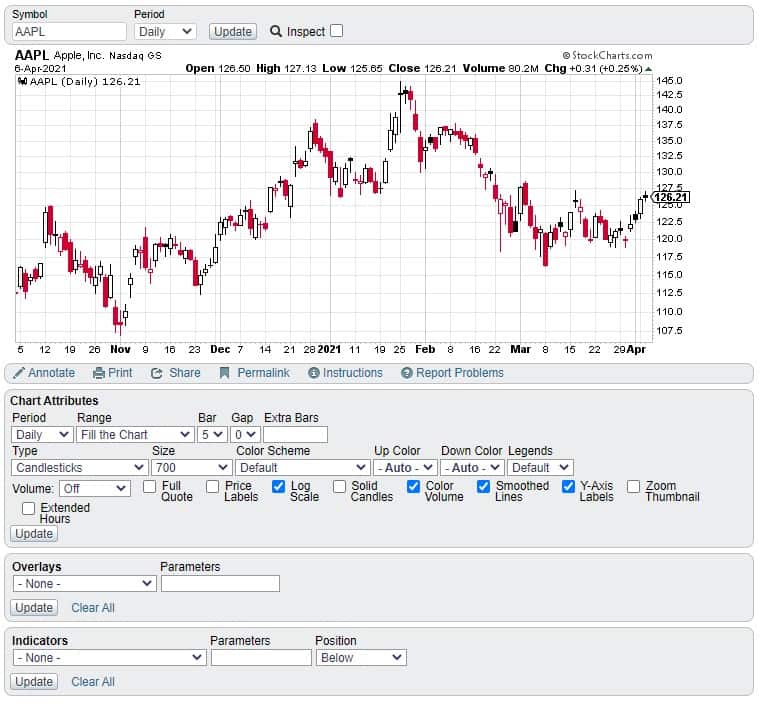
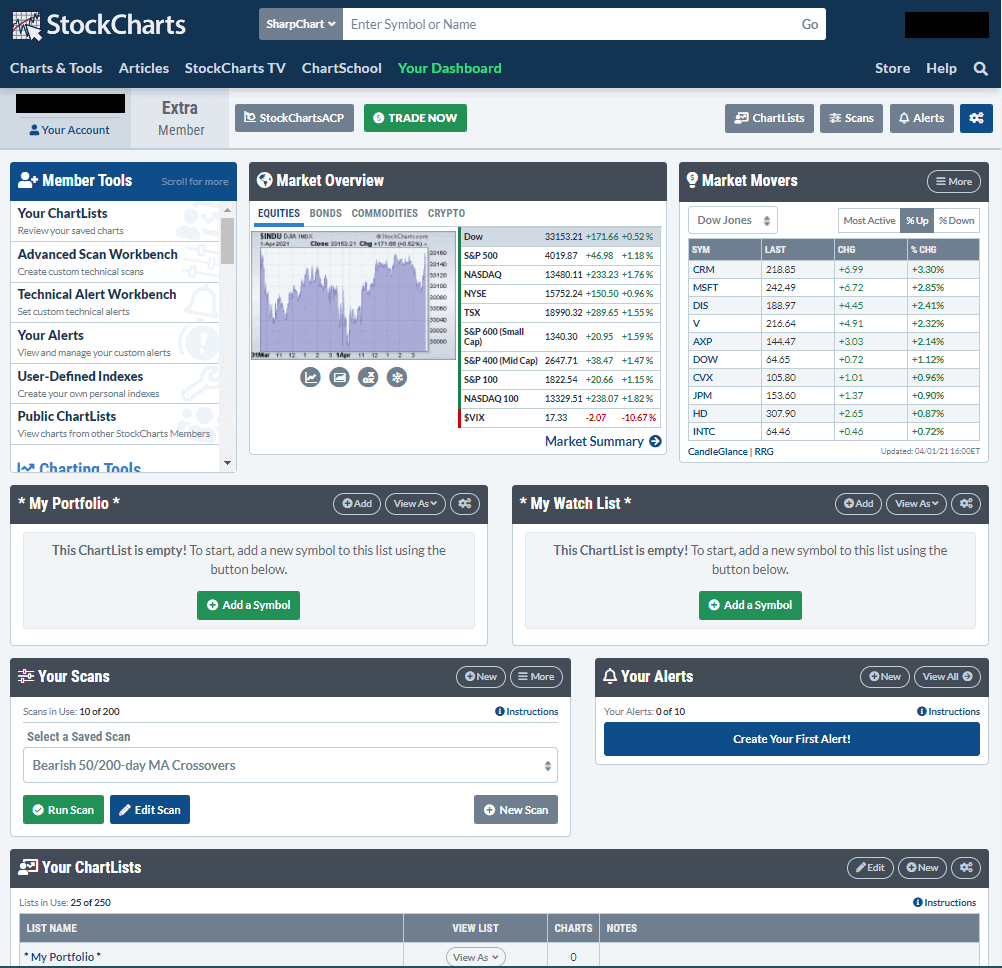
StockCharts presents a professional feel. Its dashboard is well organized and segregated into well-defined panels.
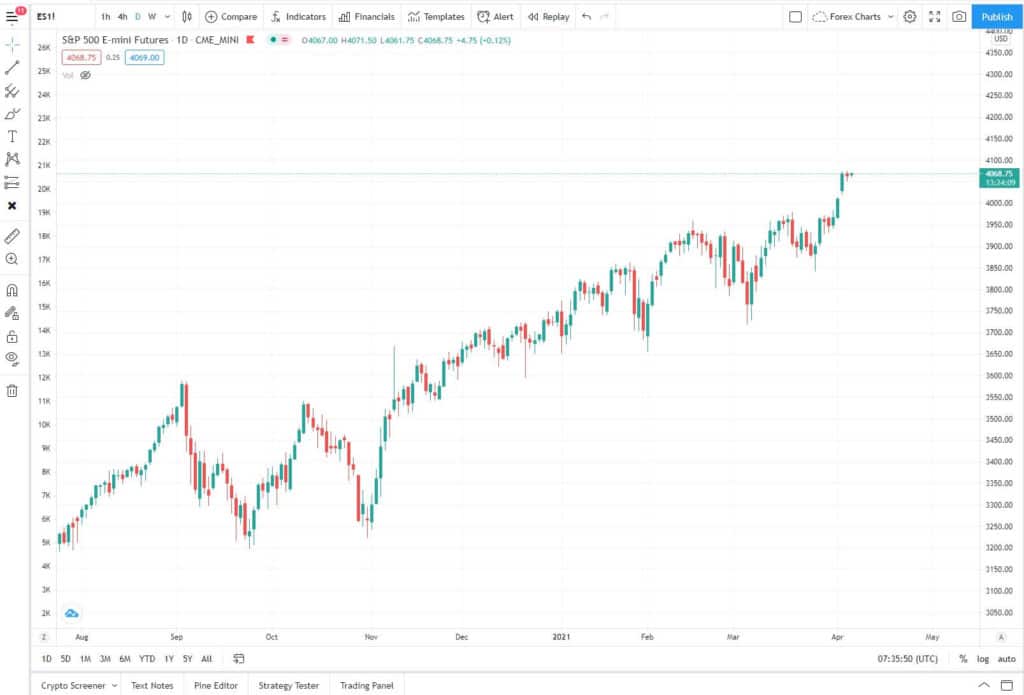
TradingView is loved by a wide spectrum of users because of its beautiful charting experience. TradingView is famous for its initiative interface charting and interface design. Charts are clean, clear and clutter free. its extremely easy to navigate around the charts to access tools and other features.
The platform uses HTML 5 charts with a sleek, smart, and lightweight design. HTML 5 charts use just 40kb with automatic data updates without the need of a refresh. The annotation tools are very fluid and intuitive. A simple example is how a tool deactivates after completing a drawing and reverting back to crosshair- this avoids drawing another line by accident.
The HTML 5 and tool design creates a professional level charting experience.
Winner: TradingView. TradingView offers a brilliant charting experience. One of the best designed charting interface designs on the market. Charts are clear, initiative and customizable.
Selection of Indicators
Both StockCharts and TradingView offer the most well known technical indicators.
TradingView has a rich and ever-growing list of third party indicators, strategies, and user-made scripts. Its native programming language Pine Script is well-known to be an easy to learn and lightweight scripting language. This opens the door to traders even without programming experience to create their own indicators and contribute to the TradingView library.
Winner: TradingView. TradingView is a runaway winner here simply because of the extensive and growing library of indicators.
Markets and Instruments
Both platforms offer access to most markets and instruments. Both platforms offer delayed data and access to official real time data only with their paid plans. This is available at an extra cost.
TradingView and StockCharts offer access to Forex, Stocks, Futures and cryptocurrencies. Stockcharts only offers free delayed end of day futures data.
Both platforms also provide free BATS data access. BATS (Better Alternative Trading System) is a Kansa City based exchange that provides unofficial real-time trading data for free. This data is often very similar to official data but traders should be aware that there can be differences (including significant volume differences). BATS data is only available for US stocks.
The following table summarizes data plans available for each platform:
| TradingView | StockCharts | |
| Free Data Plan | Delayed (Amount specific to instrument/exchange) | Delayed (Amount specific to instrument/exchange) |
| Free Unofficial Real-Data Plans | BATS* real-time | BATS* real-time |
| US Real-Time package | Official real-time data provided by NYSE and Nasdaq separately priced at $2/mo each | Official real-time data provided by NYSE and Nasdaq priced at $9.95/mo |
Winner: TradingView. Both platforms offer excellent data access and real time data options. If you require accurate real-time data, TradingView offers the most affordable and flexible options. TradingView allows users to only pay for the exchanges they use.
Charting Timeframes and Data Charting Types
TradingView offers a great selection of timeframe chart data. This ranges from the longer terms yearly, monthly, weekly to shorter time frame of days to hours to minutes and to seconds. Free plan users only have access to a good selection but not all timeframes. Pro plan members have access to all default timeframes plus can create custom timeframes.
TradingView’s chart data types include the popular bars, candles, and line. Beyond basics, more types are included such as:
- Hollow Candles
- Heikin Ashi
- Area
- Baseline
- Renko
- Line Break
- Kagi
- Point & Figure
- Range
StockCharts, offers daily, weekly, monthly, and intraday periods. It doesn’t have the extreme timeframes like annual and seconds time frames. Disappointingly the free version only offer Daily and weekly timeframe options.
StockCharts’ data charting includes the popular types like candlesticks, OHLC bars, line. Beyond basics, more types are included like:
- Renko
- Heiken-Ashi
- Kagi
- Point & Figure – StockCharts provides a dedicated chart for this along with StockChartsACP and SharpCharts.
- Histogram
- Area
- Three-line break
Winner: TradingView. Both platforms offering a comprehensive suite of data charting options and timeframes. TradingView offers more timeframe options and the ability to customize timeframes. StockCharts only offers daily and weekly timeframes with its free version. TradingView offers over a dozen options.
Alerts
TradingView’s free account provides 1 free customizable alert. This will jump to 10-30-400 active alerts from the Pro to Premium account. Users can easily program alerts with Pine Script code in their own custom indicators.
StockCharts doesn’t offer the alert feature until the Extra account level. Extra level has 10 technical alerts while the PRO account has 100 alerts.
Winner: TradingView. TradingView is a clear winner. The alerts feature is available with a free account. TradingView’s alert feature is also customizable and can provide SMS or email alerts notification!
Community
StockCharts doesn’t have a lot of avenues to communicate with other members. It does, however, offer an excellent suite of newsletters (ChartWatchers), blogs, help articles, web shows, market commentaries, live shows (StockCharts TV), chart forums (Public Chartlists) even a technical analysis school (ChartSchool).
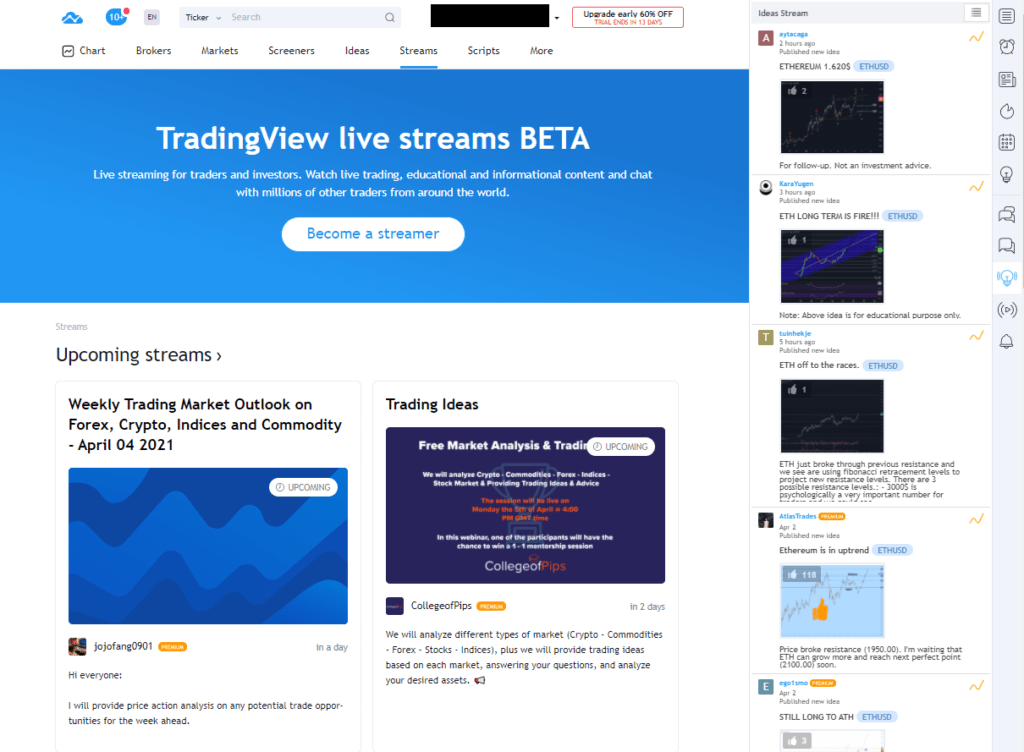
TradingView, on the other hand, is a social trading community leader. Users frequently interact with each other by freely engaging and sharing ideas through its Ideas tab. TradingView also provides a public chart where anyone can freely share trade ideas. Other than conversations, TradingView also uploads live streams with educational and live trading content.
Winner: StockCharts. Both platforms have their own sense of community. If you are the type of trader who loves sharing and learning trade ideas from a social circle, then TradingView has plenty to offer. If you are a trader who loves to focus on expert commentaries, then StockCharts is an ideal choice. I really like the quality of learn resources offered by Stockcharts.
Learning Curve
TradingView and StockCharts are both easy to learn. Both platforms are user-friendly, simple and can be learnt quickly. TradingView’s clean, clear and intuitive design makes it really easy to learn.
Winner: TradingView. From personal experience. I had an easier time grasping TradingView’s charting platform compared to StockCharts. StockCharts charting elements aren’t as clearly laid out. StockCharts’ various chart types and templates may seem a little overwhelming to start.
Support
TradingView has a dedicated help center with articles on FAQs; However, from my experience the articles I came across are not as detailed as I hoped. Beyond the FAQs, the support tab allows users to submit incident “tickets” to the support team. Priority is given to Premium members.
StockCharts, has a very in-depth and well-organized support center. The range of articles are organized into 5 main categories which include Finding Your Way Around, Charts and Tools, Scanning and Alerts, Your Account, and Learning More. The learning more section includes an extensive investing education research (Market Commentary, ChartSchool, and Instructional Videos)
Winner: StockCharts. The range of articles are vast and deatiled. ChartSchool is an excellent technical aid which is akin to financial encyclopedia Investopedia. StockCharts also has a support request page for queries not answered by basic FAQs and existing help articles.
Final Thoughts – TradingView vs StockCharts
I’ve done a few of these side by side platform comparison articles now. I think they offer a clear method of making an informed decision about what platform is best for your needs. Of course this post is based on my opinions and thoughts. I encourage you to form your own opinions. But I hope you have taken some value from this breakdown.
Both these browser based platforms are similar in many ways. Each have there own strengths that standout for me.
I’ve been a huge fan of TradingView over the years. I just love the charting interface and design. It really is a brilliant charting platform. What stockcharts impresses me with most is the quality of resource support and learning resources available with the platform.
Like I’ve said is previous comparison reviews, the platform that’s best for you depend on the weighting you give to each of the categories and features.
For this comparison review I give the win to TradingView. For me TradingView’s interface and charting design, ease of use and mobile app access are features I look for from a browser based trading platform and I add larger weighting in those areas. Your weightings are probably different. So prioritize what’s important to you to help come to your own decision.
Signup for a Essential, Plus+ or Premium TradingView subscription using the link. *New users get $15 towards a new plan.