Tradingview Volume profile indicators are a powerful set of trading tools only available with the upgraded Tradingview plans. Tradingview offers 6 different Volume profile indicators. In this post I’ll introduces each of these, I’ll explain how to add the indicators to your charts and how to customize the features.
I’ll also provide some insights into how to read and use the volume profile indicator.
What is Volume profile
Volume Profile is a charting study that maps volume traded at specific price levels. Volume profile plots as a set of horizontal histogram bars that visually describes the distribution of volume among the price levels.
This is unlike the traditional volume tool where trade activity is shown on a per bar basis (vertical histogram) for example calculating volume per day on a daily time frame.
Each bar on the Volume Profile histogram shows the total volume calculated for a particular price level. Each bar can also be colored to display amount of buy and sell volume at each price level.
There are several different ways to display and represent volume profile on your charts. These are often defined as Volume Profile types. I will discuss and compare the various Volume Profile types below.
6 Volume profile indicators on Tradingview
There are 4 types of built in volume profile indicators available in Tradingview. These include: Volume Profile Visible Range (VPVR); Volume Profile Fixed Range (VPFR); Volume Profile Session Volume (VPSV); Volume Profile Session Volume HD; Periodic Volume Profile and Auto Anchored Volume Profile [New].
Below is a brief introduction and summary of each of these:
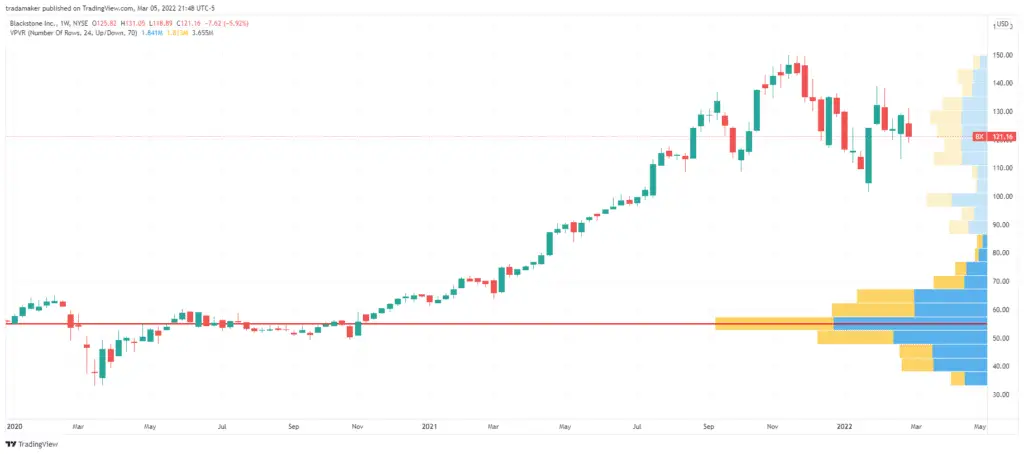
Volume Profile Visible Range (VPVR)
Calculates and displays volume profile of range of bars/candles visible in the chart. Changes as user changes chart area viewed.
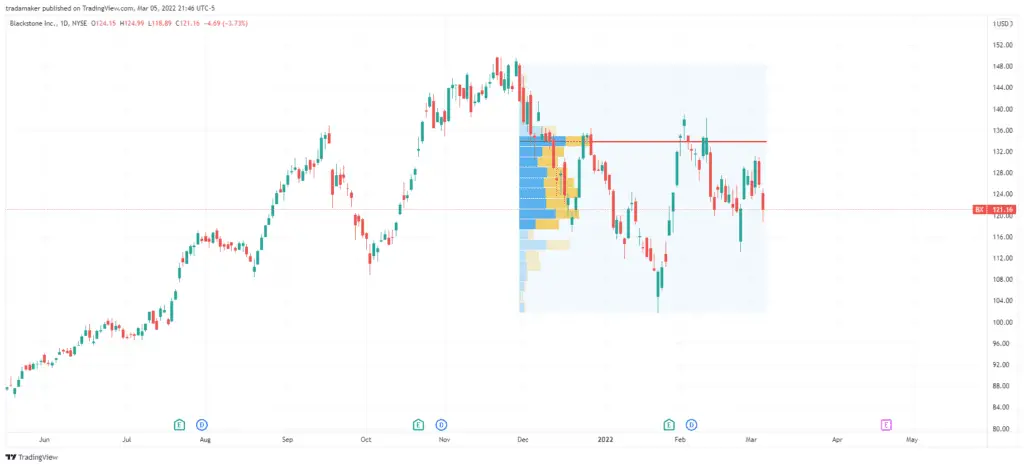
Volume Profile Fixed Range (VPFR)
Displays volume profile of a range based on an ‘on chart’ user defined time period.
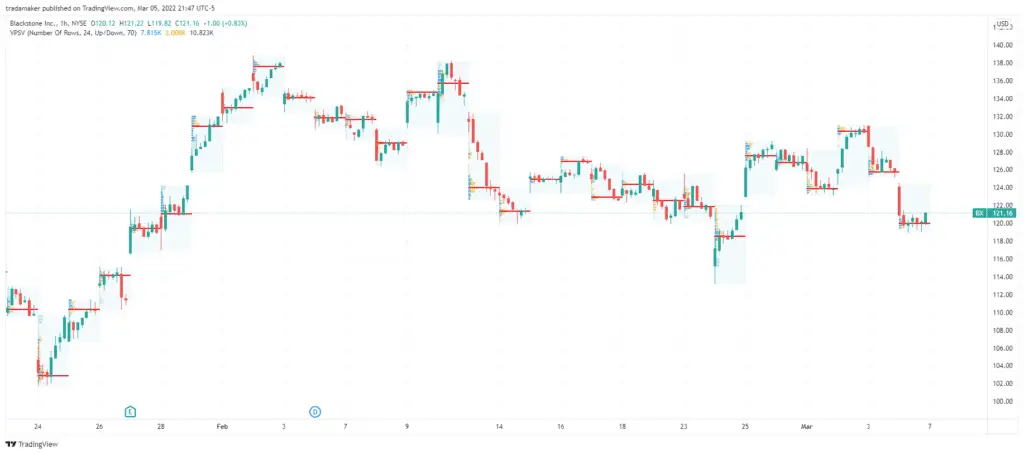
Volume Profile Session Volume (VPSV)
Shows multiple volume profiles within specified sessions or sub-sessions.
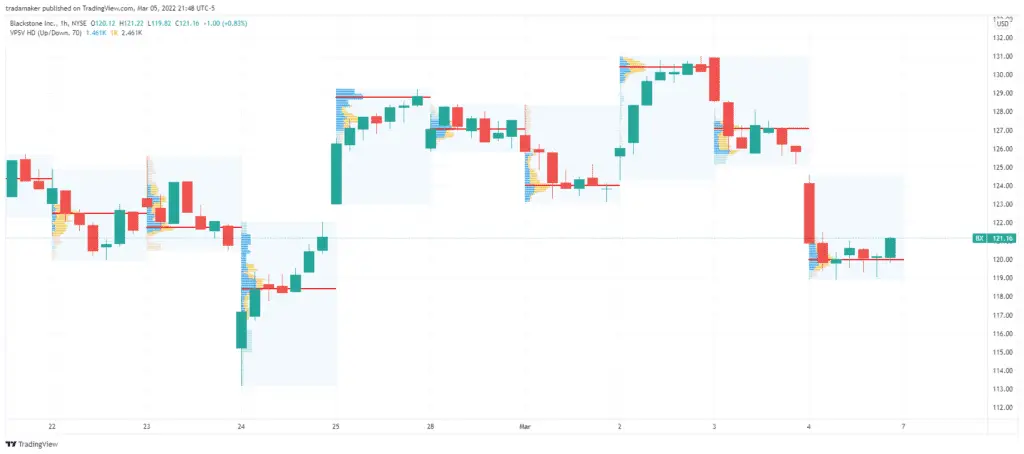
Volume Profile Session Volume HD
A more dynamic version of Session Volume.
It automatically recalculates the level of Volume Profile detail when the user scales in or out.
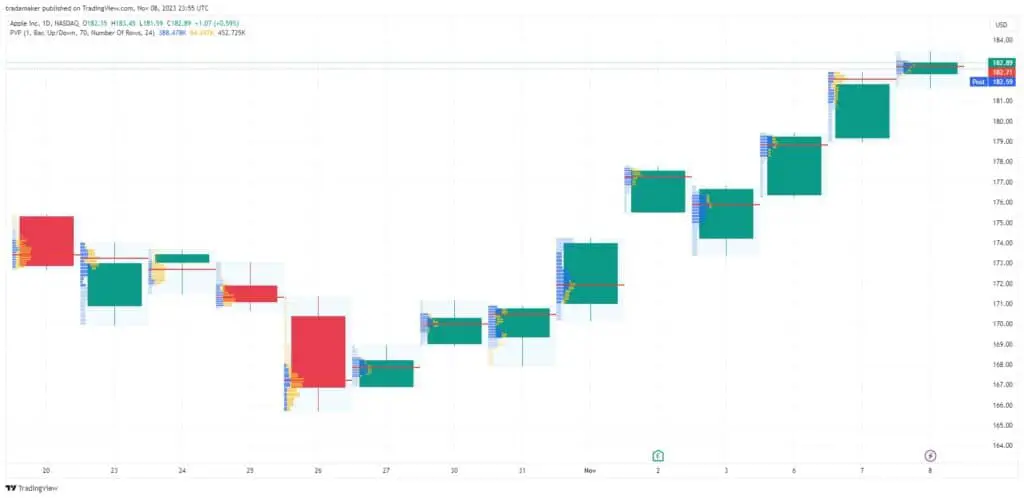
Periodic Volume Profile
The Periodic volume profile indicator will display a separate volume profile distribution for each ‘Period’ (Candle or Bar)
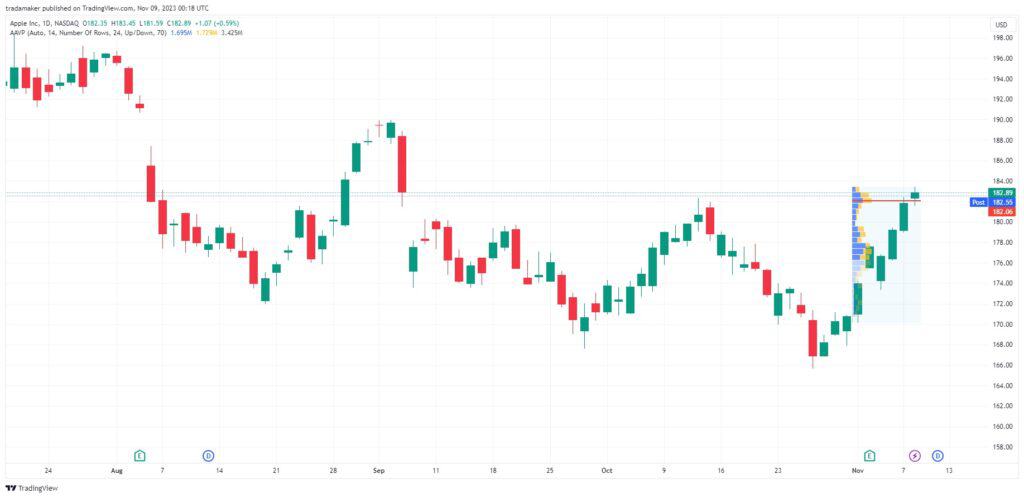
Auto Anchored Volume Profile
The Auto Anchored volume profile indicator automatically calculates the volume profile for the most important price points and volume levels.
How to add Volume Profile to Tradingview
First, if you want to add volume profile to your Tradingview charts you’ll need an upgraded Tradingview plan. The volume profile indicator is only available with the Essential, Plus or Premium plans.
Signup for a Essential, Plus+ or Premium TradingView subscription using the link. *New users get $15 towards a new plan.
Once you have an upgraded Tradingview plan you will have access to all the built-in Tradingview volume profile indicators.
To add any of these indicators in an open chart follow these steps:
- Navigate to the ‘Indicators’ icon in the top menu bar.
- In the search ‘Volume profile in the search bar of the pop up window.
- Select your preferred VP indicator from the list of ‘TECHNICAL’ built-in indicators.
Your new volume profile indicator will appear on your chart.
Note: If you select the Fixed Range Volume Profile indicator. You’ll need to click of the indicator from the list then quit out of the pop up window. You can then click on the chart to define the VP fixed range.
How to read volume profile
The Volume Profile is a technical study that is displayed as a series of horizontal histogram volume bars.
Reading a volume profile indicator requires an understanding of the key components that make up the indicator:
Volume profile components
Volume Profile bars
- The histogram bars that make up the Volume Profile.
- Horizontal bars display the volume or trade activity as specific price levels.
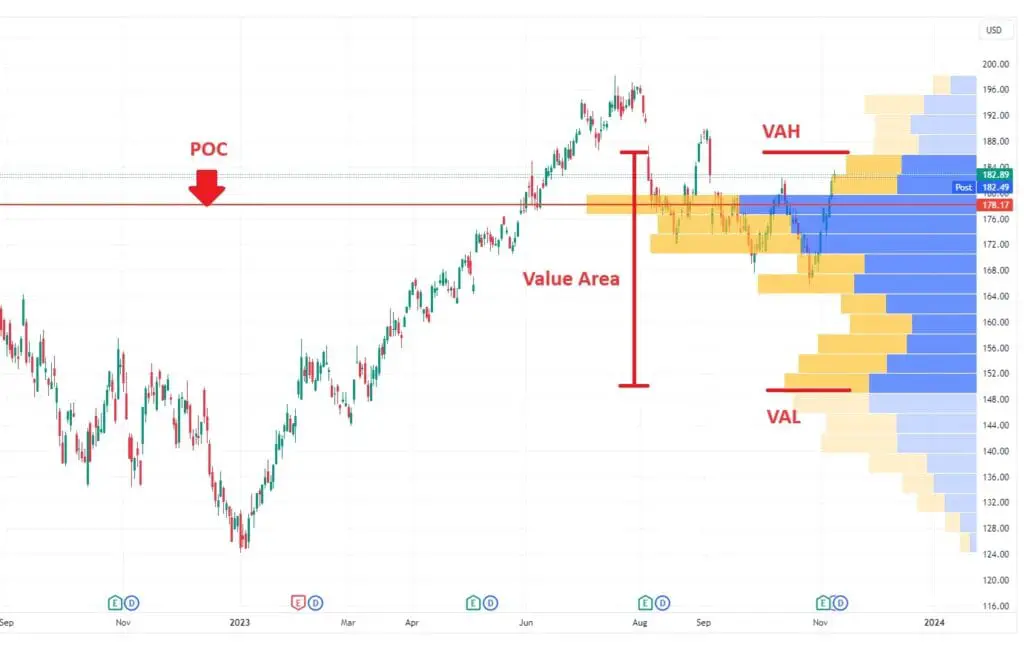
Point of Control (POC)
- POC is represented by a horizontal line that marks the price level where most of the volume occurred for the volume profile (See diagram below)
Value Area (VA)
- In auction market theory this is the price range that is defined as ‘fair value’ and is often used to help define a trading range. To learn more about auction market theory and value areas check out the link to my previous post.
- Value Area highlights the price range where a user-specified volume percentage was traded.
- By default, VA is set to 70%. This means the indicator will highlight the price area where 70% of the total volume occurred for the particular period.
- Value Area is represented with a darker shade on volume bars (See diagram below).
The Value Area contains two prominent price points. See below:
Value Area High (VAH) and Value Area Low (VAL)
- Value Area HIgh (VAH) – Highest price level within the VA (See diagram below).
- Value Area Low (VAL) – Lowest price level within the VA (See diagram below).
Many Volume profile strategies employ VAH and VAL as support/resistance levels.
Customizing Tradingview Volume profile: Indicator settings
The key VP indicator settings can be customized.
After you have added the indicator to your chart. To access your VP indicator settings in any chart follow these steps (Note: Make sure the Indicator has been successfully added to your chart):
- Go to the top left hand corner of your chart. Find the list of indicators below the charts ticker symbol.
- Hover over the Volume Profile indicator you want to customize.
- A series of horizontal menu icons will appear to the right. Select the ‘Settings’ icon (Gear). The indicator settings pop-up window will appear.
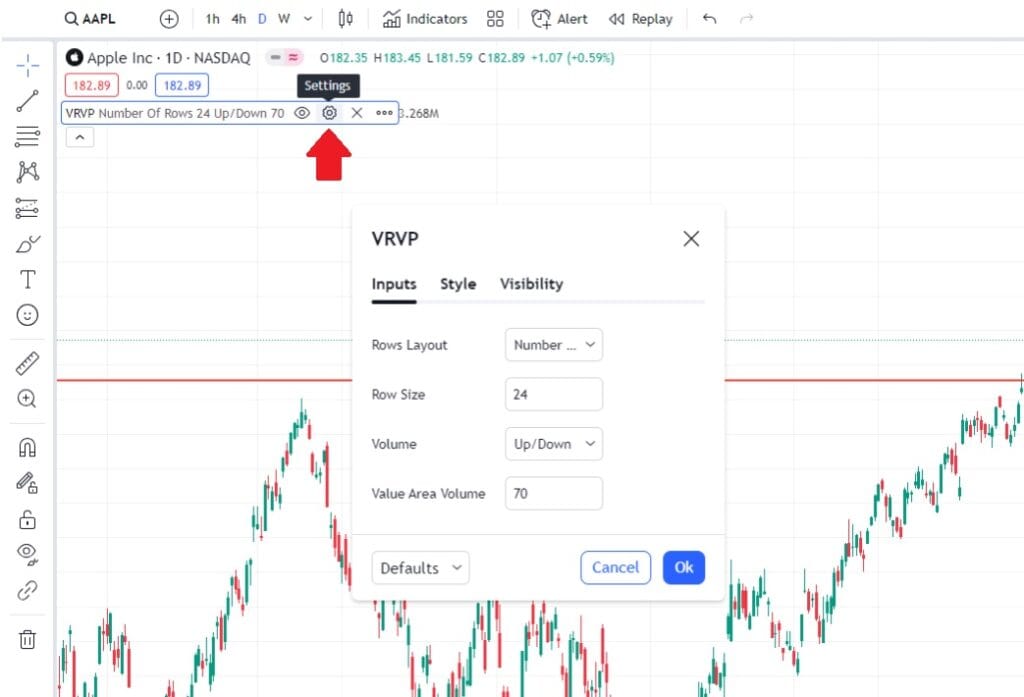
Each of the 6 VP indicators available on Tradingview have their own customization variations. The common ‘Input’ setting options include:
- Row layout: Choose how the profile is constructed. Choose either ‘Number of rows’ or ‘Ticks per row’. Row size below defines each of these.
- Row size: Metric for ‘Row layout’ selection above.
- Volume type: Each volume bar can graphically display ‘Up/Down’ volume (buy and sell) with color variation. Only the ‘Total’ volume or the volume ‘delta’ – difference between buy and sell volume.
- Value area: Define the volume profile value area as a percentage of total volume over the profile period. Defined as a profile color shade variation.
Style and visible customization options can also be selected.
How to use Volume profile
Volume Profile graphically represents market volume within the auction process.
To get the most out of the indicator and be able to successfully apply it to your trading its worth understanding what is auction market theory.
In the post at the link I’ve outlined how Volume profile (and market profile) can be used to interpret the market auction process and trade using the indicator.
Here are so of the key takeaways:
- Support and Resistance: Keys levels such as POC, VAH and VAL can be interpreted as support and resistance areas.
- Market conditions: Value areas can used to determine if a market is in balance or imbalance. Symmetrical volume profiles suggest balance conditions and a ranging market between VAH and VAL. Breakouts from these value areas with elongated volume profiles suggest an Imbalanced market with strong directional bias and trending.
As with all indicators there are numerous applications and ways of interpreting information. The ideas listed above are some of the typical ways of interpreting market conditions using the indicator.
Free volume profile indicator Tradingview
Currently there are NO free volume profile TECHNICAL (built-in) indicator options available with the Basic Tradingview plan. All Tradingview Volume profile indicators require an upgraded plan to either Pro, Pro+ or Premium.
If you’re serious about your trading and plan to use volume profile as a means to analysis market data. Then investing a relatively small amount into an upgraded plan instead of seeking out a free ‘work around’ option is in my opinion a no brainer!