In this post I’ll offer my opinion of the 7 best Tradingview Indicators.
Tradingview offers a huge selection of indicators. This list includes built-in indicators plus the best indicators in the public library. It includes some of the most popular Tradingview indicators plus the best indicators for day trading, intraday trading and swing trading. Plus the best free indicators on Tradingview.
TradingView’s indicator library is one of the most comprehensive of any trading platform – offering a huge variety of Volatility, Trend, Momentum, Reversal and Volume indicators.
This post summarizes what I think are 7 of the best TradingView indicators worth adding to your charts.
Signup for a Essential, Plus+ or Premium TradingView subscription using the link. *New users get $15 towards a new plan.
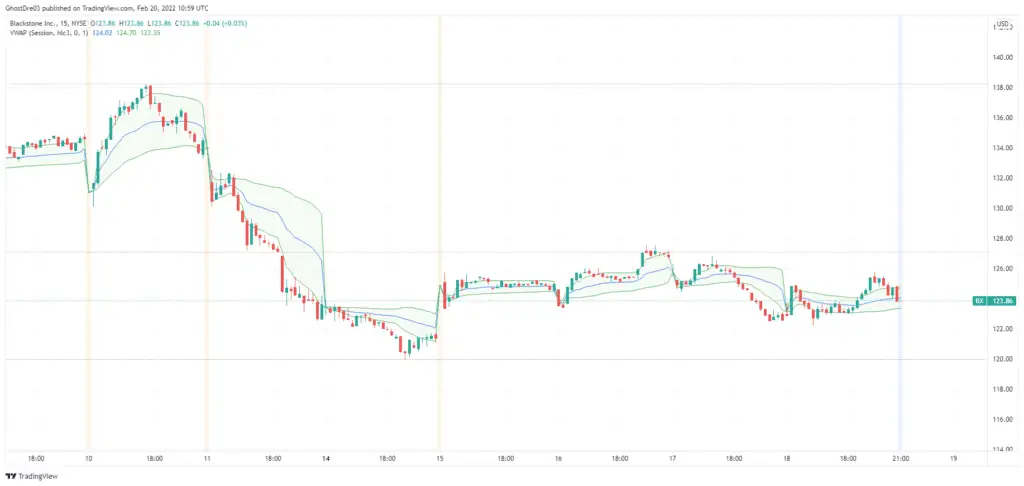
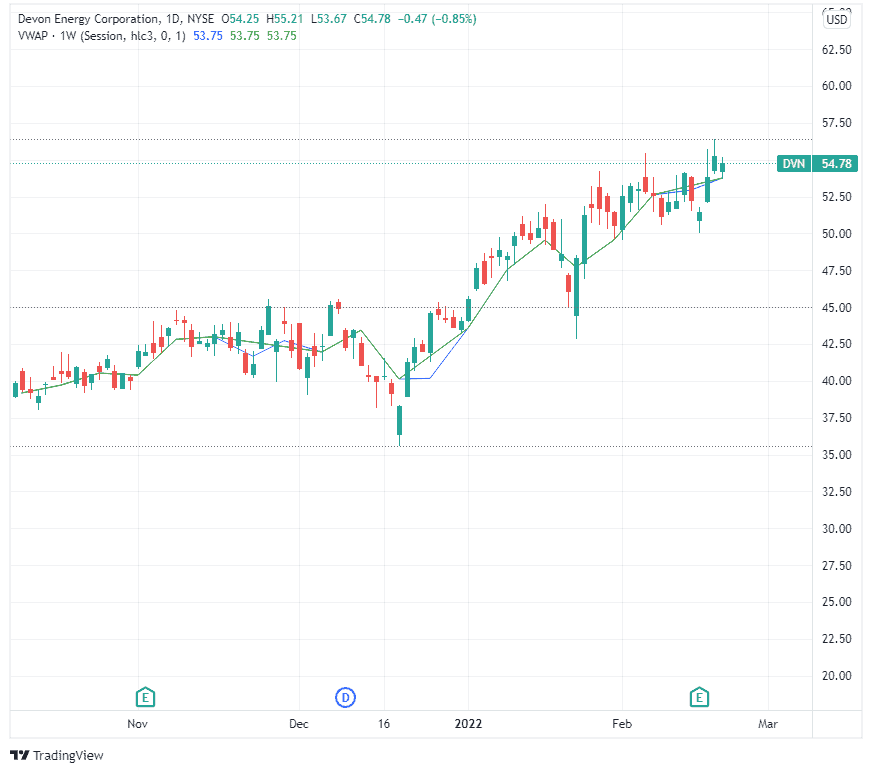
1. VWAP
What is the VWAP indicator?
- Volume Weighted Average Price computes a period’s average price as weighted by volume.
- It’s calculated by taking the total dollar amount traded divided by the volume traded over a specified period.
- VWAP is behaves as a moving average indicator that is weighted for volume opposed to being calculated as a simple average (SMA) or an exponential function (EMA).
What VWAP indicator is used for?
- VWAP in itself is commonly used as a benchmark for institutional investors and market makers.
- As an indicator, traders use VWAP as a trend identifier and sentiment gauge. It functions similar to a moving average indicator but is adjusted for changes in volume though out the trading period. It applies more weighting to trading periods with higher trading volume.
Why use the VWAP indicator?
- The VWAP indicator is a great confirmation indicator to support other signals and sentiments.
- If you prefer making decisions based on trading volume; a key trading metric. Then consider using VWAP as an alternative to other moving average indicators. VWAP is one of the best Tradingview indicators for day trading in my opinion.
How to add the indicator on Tradingview
Follow these simple steps to add the VWAP indicator:
- Step 1: Launch chart
- Step 2: From the main toolbar, click Indicators, Metrics & Strategies
See circle below
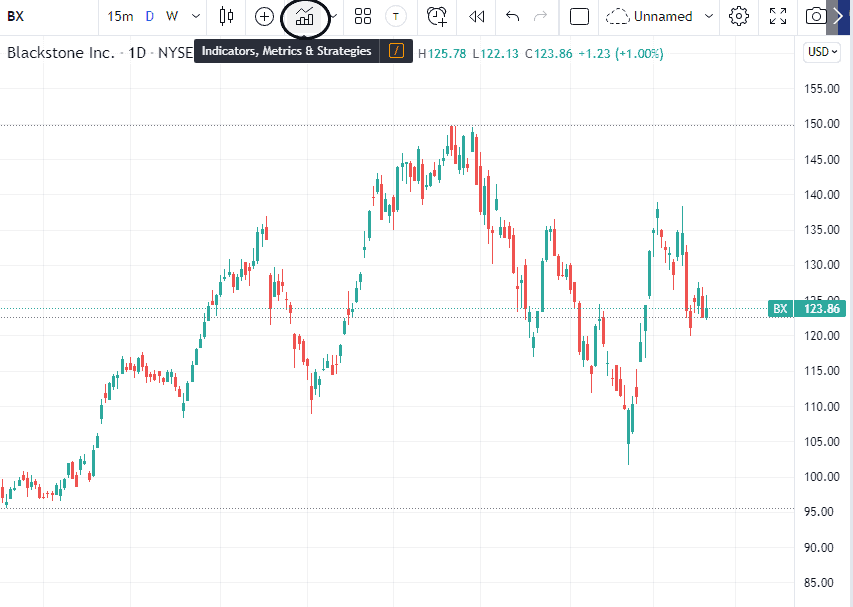
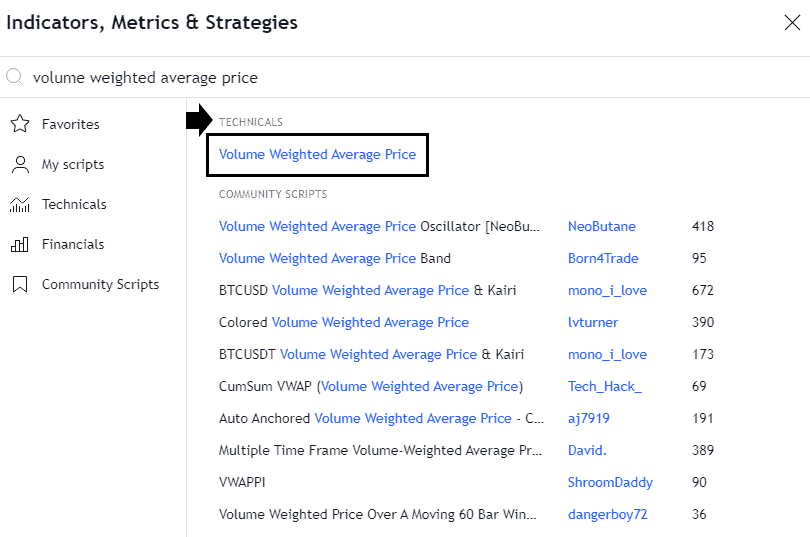
- Step 3: On the search bar, type the Volume Weighted Average Price
See black box below
- Step 4: From the results, select the one under Technicals
2. RVOL (Volume+ RVOL by time of day)
What is RVOL?
- RVOL is an indicator that compares current volume to the average trading volume in the past.
What is Volume+ (RVOL by time of day)?
- This script is an enhanced version of the Relative Volume (RVOL) indicator. Volume + computes RVOL (current volume vs past volume), but instead of just basing it from the past’s average trading volume, the indicator is based on average volume at a certain time of day of a particular day period as chosen by the user.
- The Volume + indicator provides a volume comparison of related periods in the day (e.g., volume at the close or open in the past 10 days).
- Volume + is a volume analytics tool that aims to create apples-to-apples comparisons.
Indicator Catergory: Custom Script by ZenAndTheArtOfTrading
- Volume+ (or RVOL by Time of Day) is one of the community-made scripts that anyone can access for free from the community library.
Why use the Volume + indicator?
- This indicator is far more customizable and targeted than traditional RVOL indicators which is why we like it so much.
How to add the indicator?
Follow steps 1 and 2 in the ‘How to add the indicator’ in VWAP indicator section above
- Step 3: On the search bar of the Indicators, Metrics & Strategies window, type RVOL by time of day
- Step 4: Under Community Scripts, Click Volume + (RVOL By Time of Day)
Here’s how the indicator looks when applied to a chart:
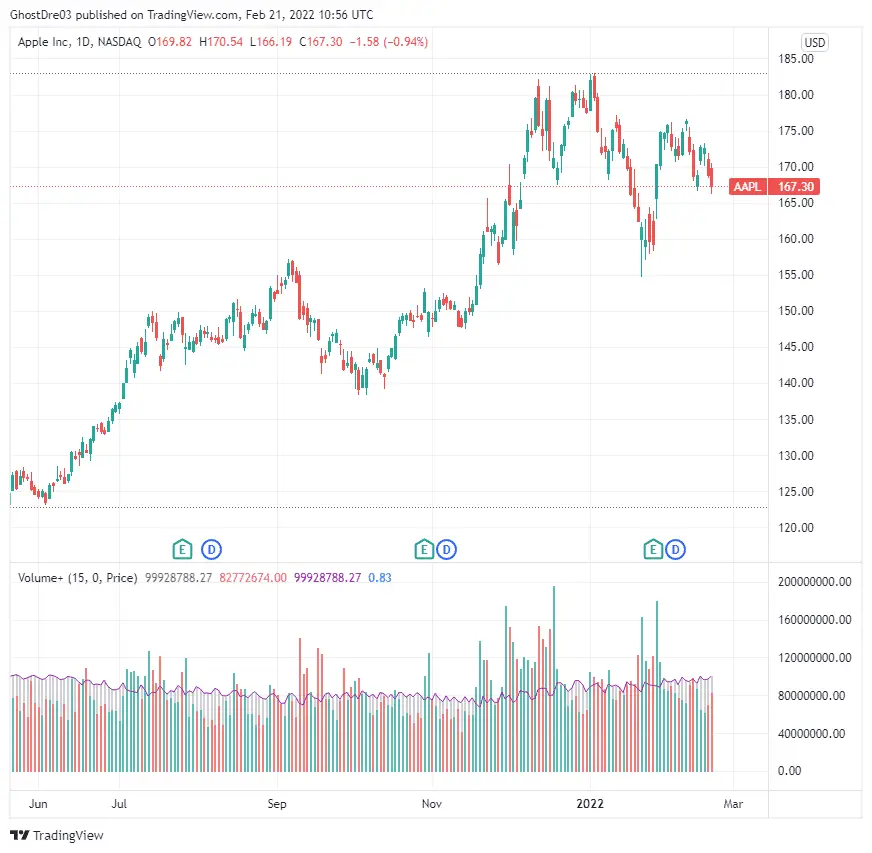
Customization options of Volume+
Volume+ has a handful of add-on features. A notable one to point out is that it offers four different bar color settings:
| Volume bar characteristic | |
| Heatmap | Changes to a brighter color when RVOL is higher |
| Price | Changes based on up and down price action Bar color changes to green for up candle, and red for down candle |
| Traffic | Changes color based on RVOL % Red – RVOL between 1.0 and 1.5 Orange – RVOL between 1.5 and 2.0 For a complete bar color description, click here |
| Trigger | Bar color changes to teal when alert condition is triggered |
2. Volume Profile
What is the Volume Profile?
- Tradingview Volume Profile is a charting study focusing on the analysis of price and volume characteristics.
- Volume profile displays horizontal volume histogram bars at various price levels. Volume profile is a graphical tool that allows traders to quickly identify what volumes are being traded at specific prices.
- TradingView offers four Volume Profile indicators: Fixed Range, Session Volume, Session Volume HD, and Visible Range.
*Volume Profile is only available with an upgraded Essential, Plus or Premium plan. If you use volume profile or interested in using it in your trading then definitely consider upgrading to your Tradingview subscription.
Signup for a Essential, Plus+ or Premium TradingView subscription using the link. *New users get $15 towards a new plan.
If you’d like to learn more about the other benefits of upgrading your tradingview plan check out my post ‘Is Tradingview worth it?‘
Why use Volume Profile?
- Volume profile helps traders easily identify areas of highest of lowest trading volume.
- Volume identifies price areas of highest supply and demand. High volume areas represent high demand low volume areas represent greater supply. This information can be used to identify price turning points or price ranges.
How to add the indicator?
Before we dive into the instructions, note that Volume Profile indicators are only available to Essential, Plus, and Premium users. Only those with upgraded plans have access to all Volume Profile indicators.
Follow steps 1 and 2 in the ‘How to add the indicator’ in VWAP indicator section above
- Step 3: On the search bar of the Indicators, Metrics & Strategies window, type Volume Profile
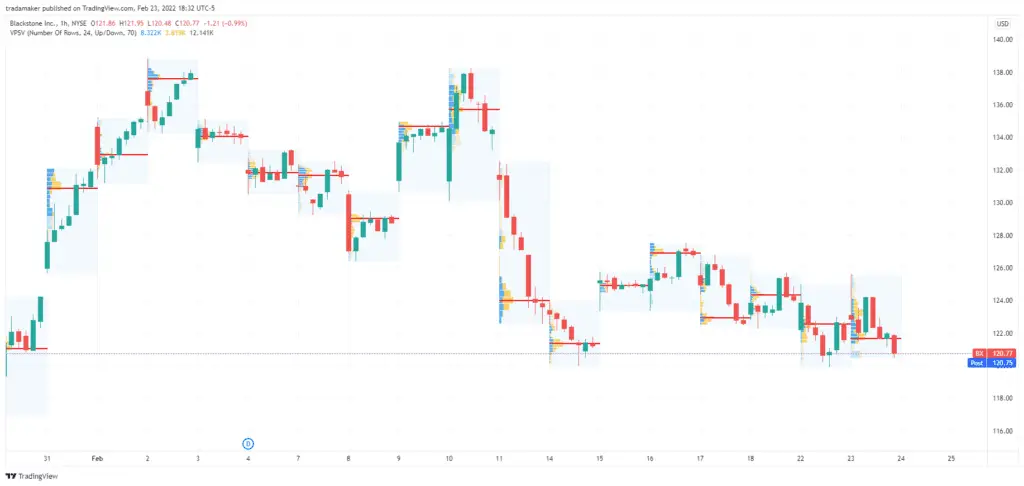
- Step 4: Under Technicals, select Volume Profile Session Volume See box below
Here’s how the indicator looks when applied to a chart:
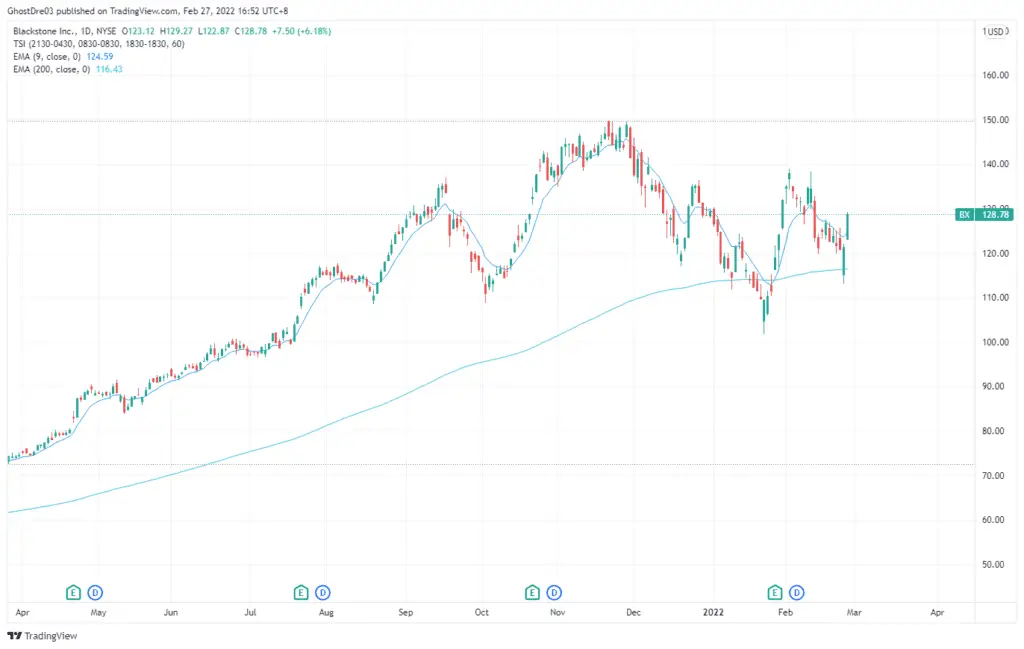
4. Trading Session indicator
Indicator Category: Custom script by ZenAndTheArtOfTrading
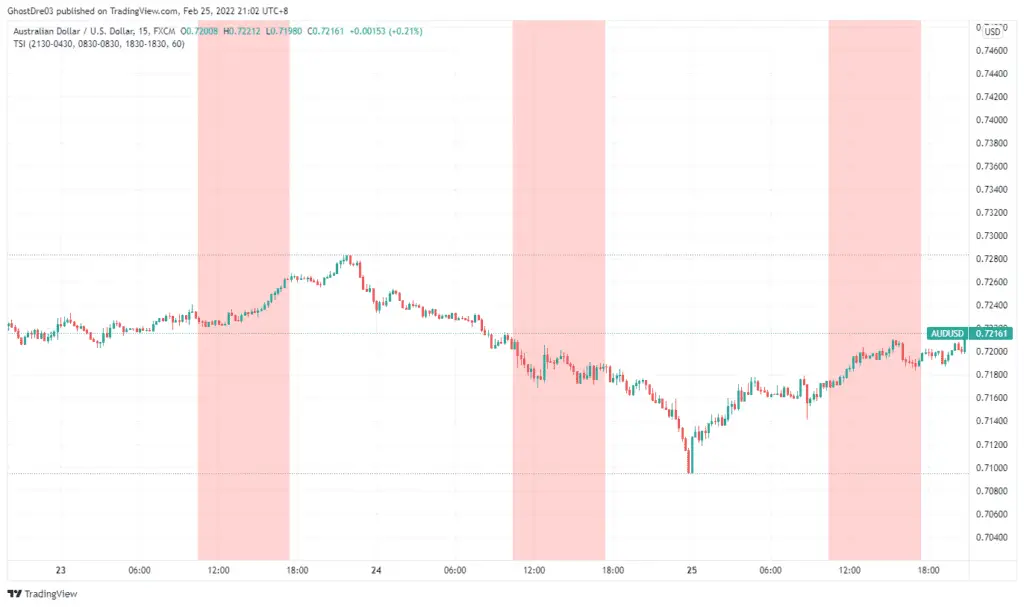
What is the Trading Session indicator?
- The Trading Session indicator (or the TSI) applies a shaded chart overlay to represent user-specified time zones.
- TSI can be applied to various time periods to represent trading sessions.
- TSI also offers alerts to signal the start and end of the session.
Why use the Trading Session indicator?
- This indicator allows users to quickly identify specific trading sessions or time periods.
- It can be used to identify when a specific market opened. When it closed. If offers the ability to visually compare price action between sessions.
- It also allows used to distinguish between sessions. For example different colors can be used to distinguish the Hong Kong trading session from the London or New York trading sessions.
I love this indicator. It organizes my charts by session for easy reference and comparison!
How to add the indicator
Follow steps 1 and 2 in the ‘How to add the indicator’ in VWAP indicator section above
- Step 3: On the search bar of the Indicators, Metrics & Strategies window, type Trading Session
- Step 4: Select the one from ZenAndTheArtOfTrading under community scripts
5. EMA indicator (Exponential Moving Average )
What is the EMA indicator?
- The Exponential Moving Average (EMA) is one of the most popular Tradingview indicators.
- EMA indicator is a single line that tracks average price over a specific time period.
- Moving averages are used to identify long, medium, as well as short-term price trends.
The EMA is calculated by iteratively averaging historical price over a specific time period. The difference between EMA other MA’s, Is EMA’s assign exponentially greater weight to more recent price performance. This makes them EMA more sensitive to recent price movements.
Why use the EMA indicator?
- EMA indicator offers a simple way to identify average price over a period of time.
- EMA’s help traders graphically identify where price is in relation to where it has been historically.
- It offers a simple method for identifying price trends and market momentum.
- It’s also commonly used as a type of dynamic support and resistance although I’m not convinced that this has any real value.
How to add the indicator
Follow steps 1 and 2 in the ‘How to add the indicator’ in VWAP indicator section above
- Step 3: On the search bar of the Indicators, Metrics & Strategies window, type Moving Average Exponential
- Step 4: Select the one under Technicals
Here’s how the indicator looks when applied to a chart:
6. Relative Strength Index (RSI)
What is the RSI indicator?
- The Relative Strength Index (RSI) one of the most popular Tradingview indicators.
- The RSI indicator is a momentum oscillator that measures the speed and change of price movement.
- It’s calculated using the average price gain change with time over the average price loss with time. The calculation oscillates between 0-100.
- It’s used to graphically identifies where markets are overbought or oversold. Areas of oversold and overbought readings are often interpreted as potential reversal zones. An RSI below 30 is considered oversold. An RSI above 70 is considered overbought.
Why use the RSI indicator?
- The RSI indicator is used to generate potential trend reversal signals.
- Prices trading in areas over bought or over sold can signal a potential reversal.
- When used in combination with a price chart. The RSI can also be used to signal divergences. Price that moves in the opposite direction of the RSI can also signal a potential reversal.
How to add the indicator
Follow steps 1 and 2 in the ‘How to add the indicator’ in VWAP indicator section above
- Step 3: On the search bar of the Indicators, Metrics & Strategies window, type RSI
- Step 4: Select the one under Technicals
Here’s how the indicator looks when applied to a chart:
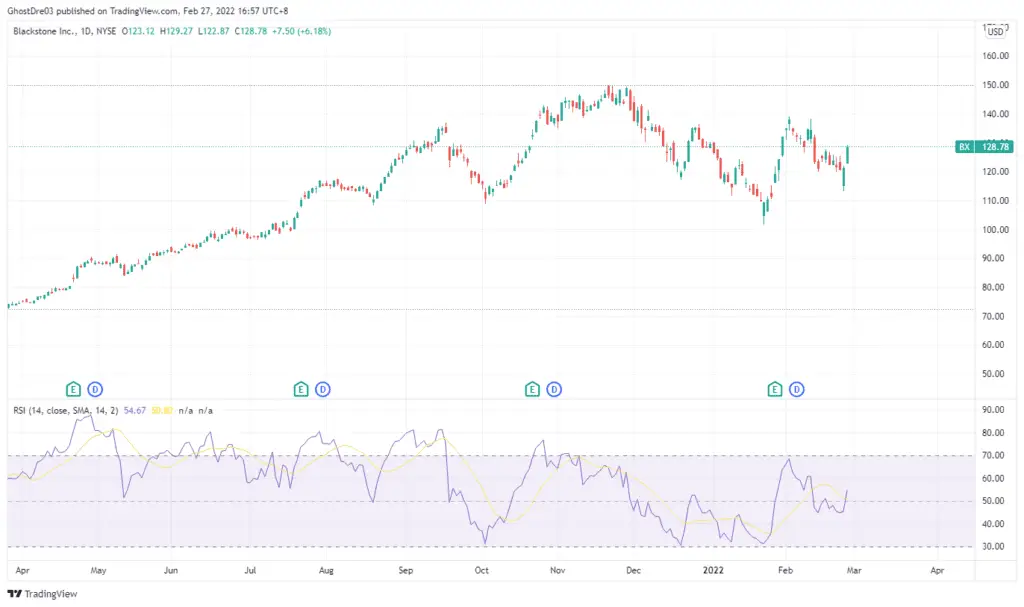
Update: TradingView updated its RSI to include a moving average. It operates in the same way as the standard MA.
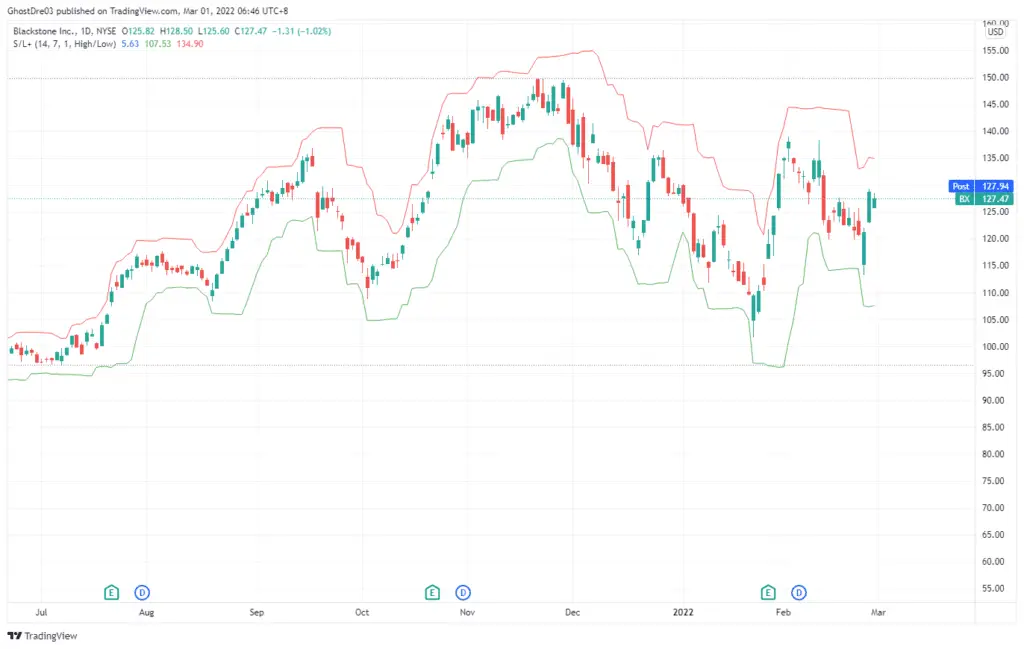
7. ATR Trailing Stop Indicator
Indicator Category: Custom Script by ZenAndTheArtOfTrading
What is ATR Trailing Stop Indicator
- The ATR Trailing Stop is basically a combination of Average True Range (ATR) and trailing stop.
- ATR is a volatility indicator that calculates the average true range of price movement over a specific period. ATR is commonly used as a metric to identify stop loss placement.
There are three line overlays – each with their own value and color codes:
- ATR – default color blue
- Long trailing stop – default color green
- Short trailing stop – default color red
Why use the ATR Trailing Stop indicator?
- The indicator automatically calculates trailing stop distances based on calculated ATR.
- The ATR Trailing Stop indicator is great for active traders who want indicator an efficient, convenient and data driven methodology for stop loss placement.
How to add the indicator
Follow steps 1 and 2 in the ‘How to add the indicator’ in VWAP indicator section above
- Step 3: On the search bar of the Indicators, Metrics & Strategies window, type ATR Trailing Stop Loss
- Step 4: Select the one under Community by ZenAndTheArtOfTrading
Signup for a Essential, Plus+ or Premium TradingView subscription using the link. *New users get $15 towards a new plan.
FAQ’s
Where to access TradingView indicators?
TradingView indicators can be found with one click of a button on the chart.
On the main toolbar, click ‘Indicators, Metrics, and Strategies’ or simply the line chart with volume bars icon. See arrow below
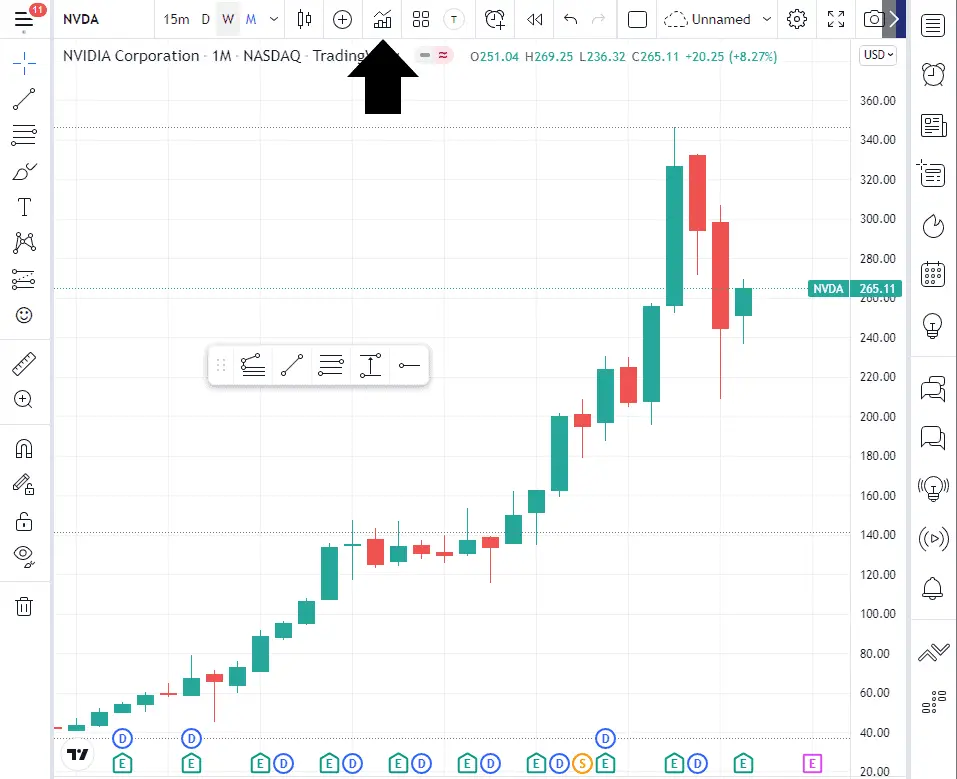
Shortcut: Type / on your keyboard to open the same indicators window:
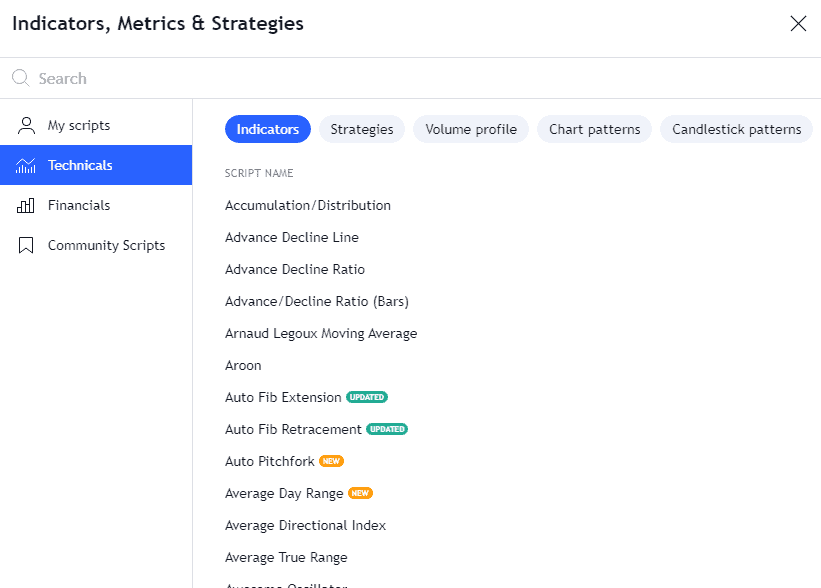
To add an indicator to a chart, simply click on an indicator from the ‘Indicators, Metrics & Strategies’ window.
The selected indicator will instantly appear on the chart either as a chart overlay or in a new panel below the chart.
Its value and customizable parameters will be displayed in the chart legend at the upper left of the chart.
The indicator will automatically appear on the chart in its standard and default settings.
How many indicators are free in TradingView?
TradingView offers a comprehensive library of FREE indicators regardless of a user’s account subscription.
There are 4 main categories of indicators:
- Built-ins [free] – named Technicals on the platform.
- Public library [free] – contains a list of community scripts created by TradingView users. Named Community Scripts on the platform.
- My scripts [free] – user-created scripts
- Volume profile [paid]
All the categories – except the volume profile – are free, and can be applied on the charts.
The built-in list alone contains more than 100 free indicators which includes the popular moving averages and oscillators. The tradingview public library indicators are a growing list of hundreds if not thousands of indicators.
One thing to note is that although these large numbers of indicators are free, Basic plan users can only add up to a maximum of 3 indicators at one time.
How do I get more than 3 indicators on TradingView?
TradingView allows users to add more indicators to a chart through its paid plans.
See how each of the plan’s indicator limit stacks against each other see table below:
| Basic | Essential | Plus | Premium |
| 3 | 5 | 10 | 25 |
To take advantage of higher indicator limits, consider upgrading to Essential, Plus or Premium.
Signup for a Essential, Plus+ or Premium TradingView subscription using the link. *New users get $15 towards a new plan.