In this post I’ll detail all you need to know about using the VPVR indicator in Tradingview.
I’ll cover what is the VPVR indicator in Tradingview, I’ll explain how to access the VPVR indicator on Tradingview plus explain in detail how to use it.
It’s worth mentioning straight away that this indicator is only available with a Tradingview upgraded plan either Essential, Plus or Premium. if you want to try out the indicator consider signing up for a FREE trail here. Or take a look at the offer below if you want to upgrade.
Signup for a Essential, Plus+ or Premium TradingView subscription using the link. *New users get $15 towards a new plan.
What is the VPVR indicator in TradingView?
Volume Profile Visible Range or VPVR is one of four types of the Volume Profile indicators available on Tradingview: These include Visible Range (VPVR), Fixed Range (VPFR), Session Volume (VPSV), Session Volume HD.
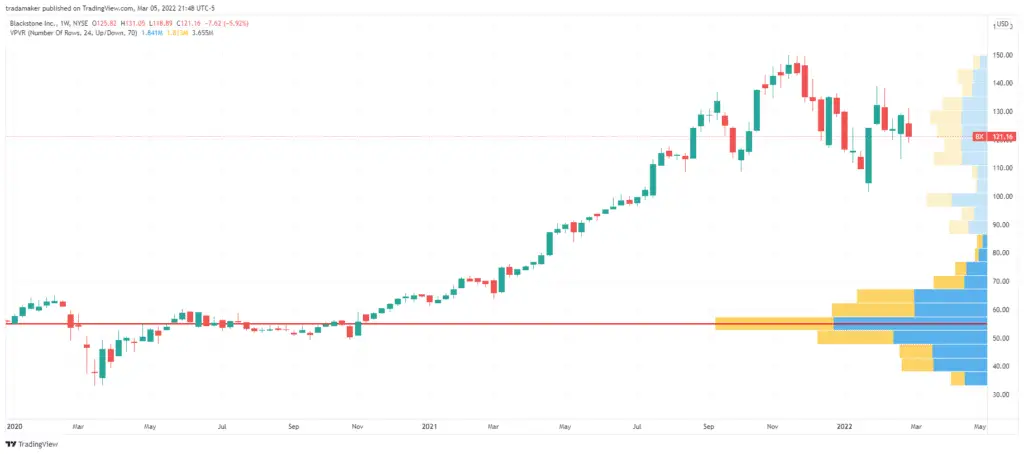
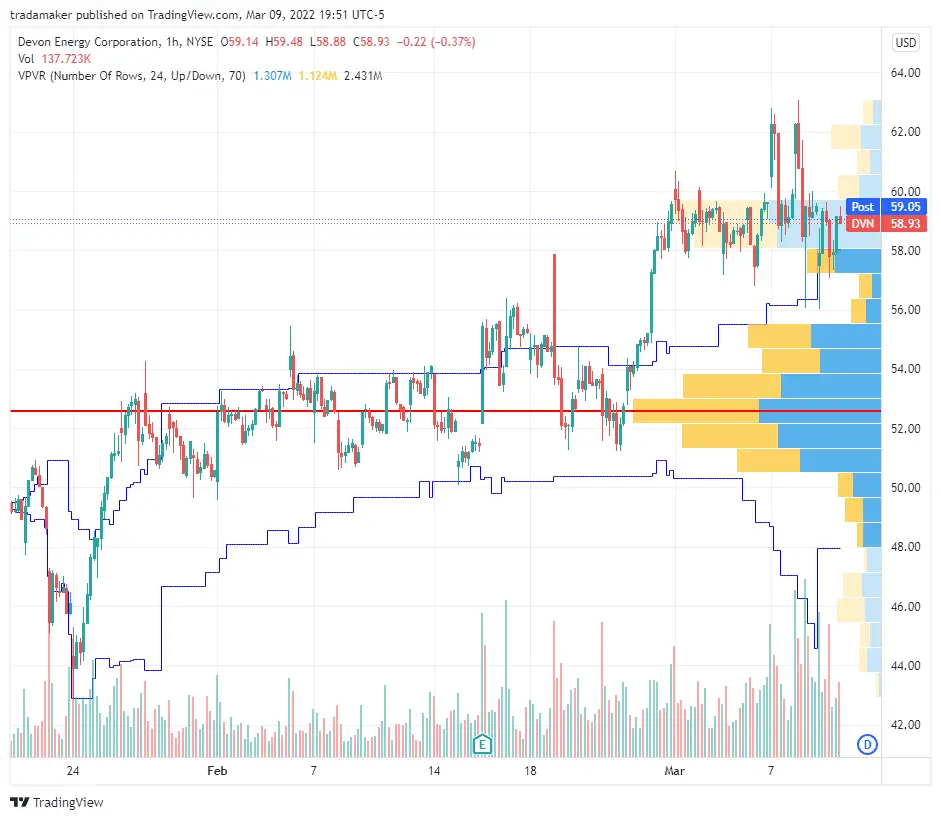
Tradingview VPVR calculates and displays a volume profile across the charts VISIBLE Y-Axis (Price); hence it’s called Volume Profile Visible Range.
VPVR is a dynamic calculation of volume activity. It automatically recalculates the Volume Profile when chart scaling changes on the X- and Y axis are made.
How do I view VPVR in TradingView?
To access and view all volume profile indicators in Tradingview you’ll first need an upgraded plan (TradingView Essential, Plus, and Premium).
Signup for a Essential, Plus+ or Premium TradingView subscription using the link. *New users get $15 towards a new plan.
Where to find the indicator?
All Volume Profile options can be found in the Indicators, Metrics, & Strategies window, under the ‘Technicals’ category with its own tab titled Volume Profile:
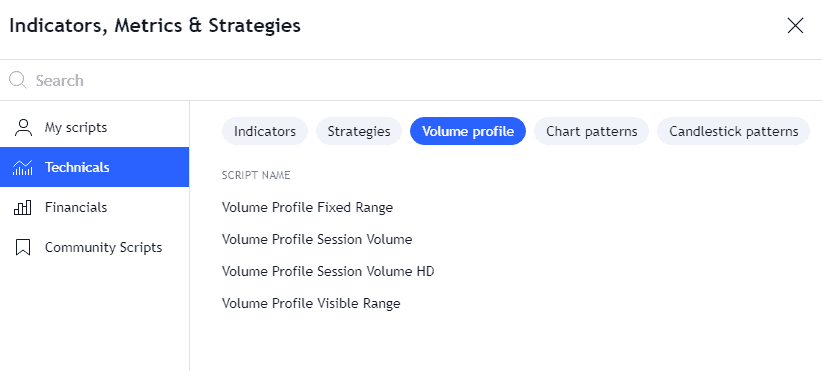
- Once clicked, the four Volume Profile options will appear.
- Select Volume Profile Visible Range.
- The indicator will automatically appear as a chart overlay.
Is VPVR free on TradingView?
No, the VPVR is not available free with tradingview. It is only included in the upgraded plans. Free/Basic users do not have access to this indicator.
However, If you’re curious about using volume profile as part of your trading strategy then Tradingview does offers a free 30 day trial to any upgraded plan. so if your wanting to try the indicator out signing up for a free trial is a great option!
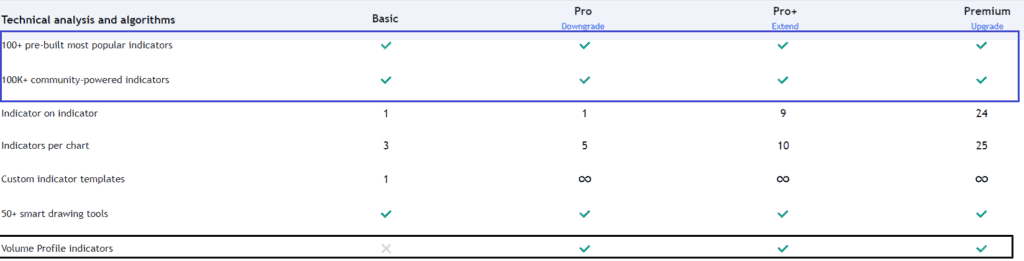
An upgrade to either Essential, Plus or Premium will give full access to all the tradingview volume profile indicators.
If you are regular user of the volume profile indicators upgrading to at least the Essential plan will give you access to the full suite of Tradingview indicators plus loads of other benefits of an upgraded Tradingview plan.
How to use the VPVR indicator in Tradingview?
In this section, we will explore:
- How to add the VPVR indicator on the chart
- Understanding and interpreting some important components
- Customizing settings
How to add the VPVR indicator
Step 1: Launch TradingView chart
Step 2: Click the Indicators, Metrics, & Strategies button
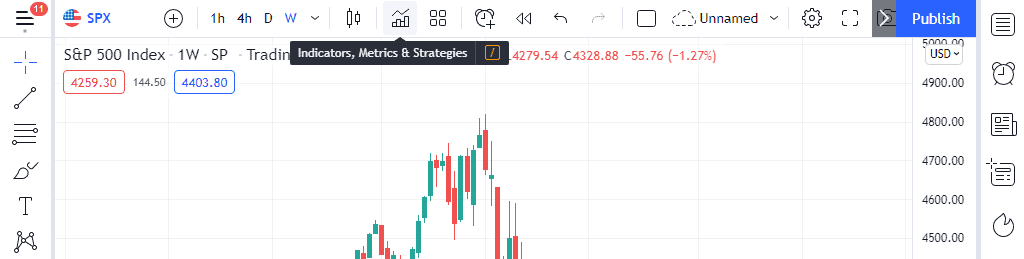
Step 3: From the window, click Volume Profile under Technicals then select Volume Profile Visible Range
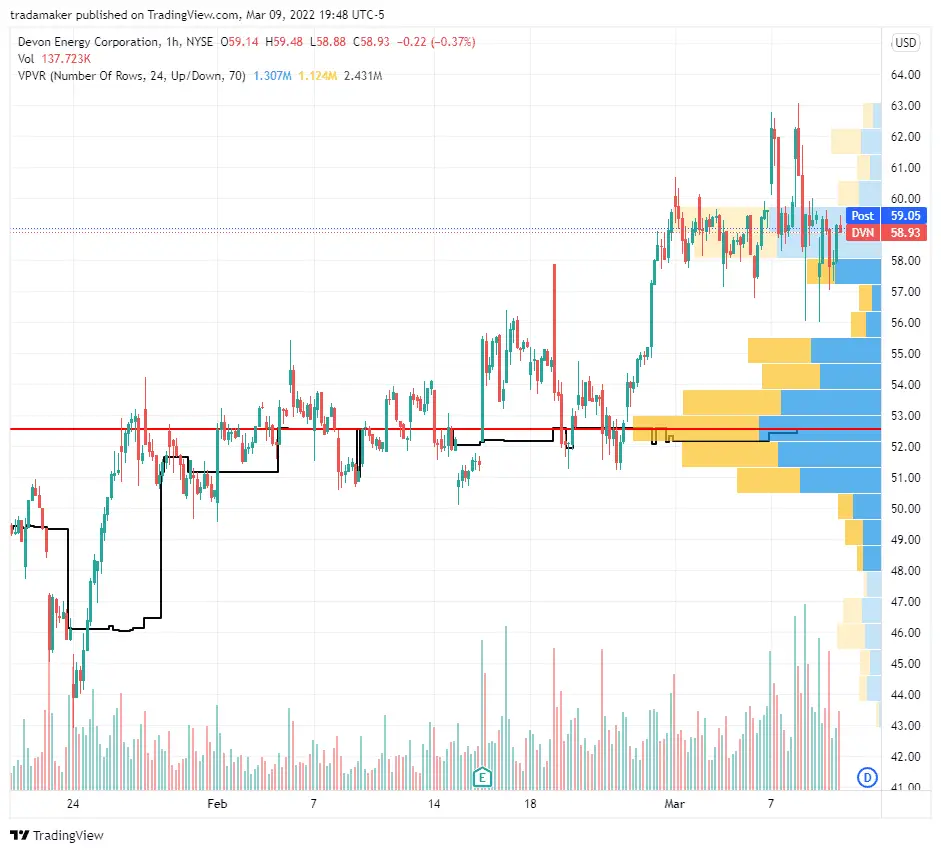
Understanding the components of the Volume Profile
The Volume Profile is a technical study that is displayed as a series of horizontal histogram volume bars.
There are several components that make up the indicator that are typically referred to in technical analysis. These include, the point of control (POC), Value Area (VA), Value Area High (VAH) and Value Area Low (VAL).
If you are interested in learning more about each of these, want to learn how to read the Tradingview volume profile indicators and how to use it. Then check out the link.
Customizing VPVR indicator settings
Most of the VPVR’s parameters can be customized.
To start, click the gear icon beside the indicator legend at the top left of the chart area. See arrow below:
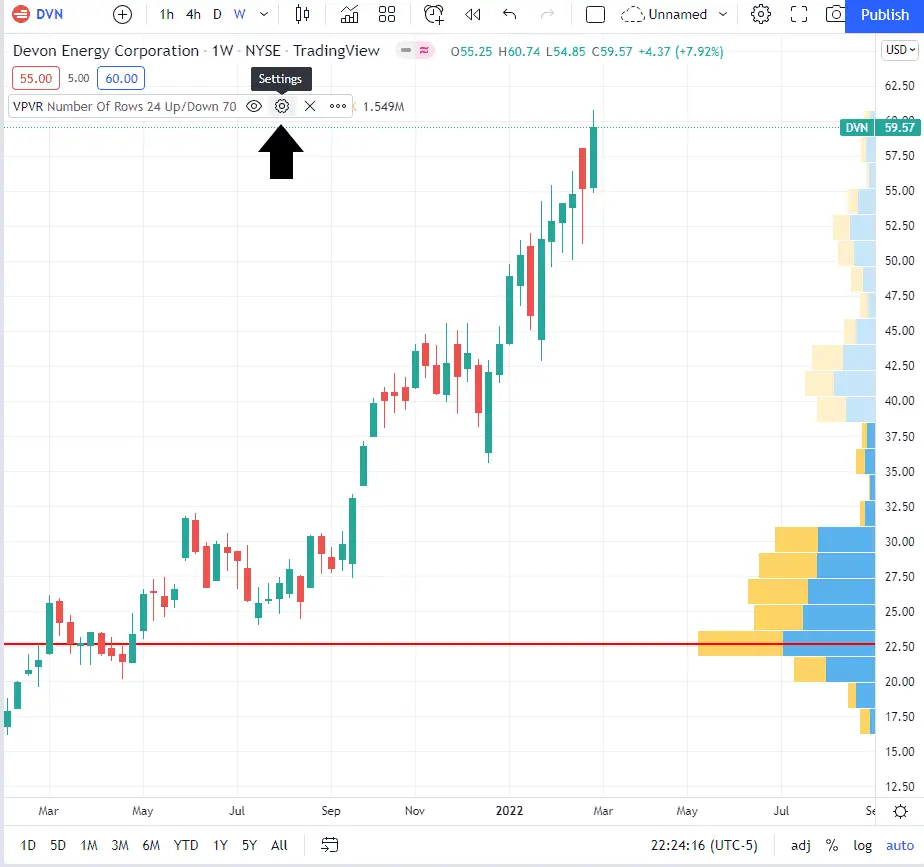
The Settings pop-up window will appear:
There are three tabs: Inputs, Style, and Visibility.
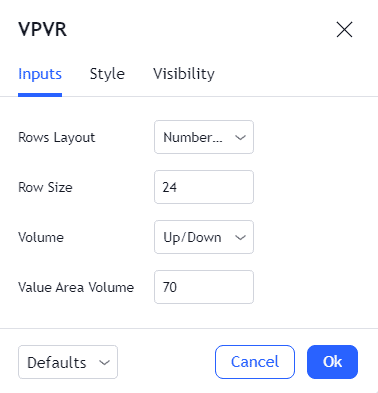
Inputs
Rows Layout – There are two options here; ‘Number of rows’ or ‘Ticks per row’.
- ‘Number of rows’ allows users to specify the number of rows (bars) in the profile vertical range. The more rows the higher the price resolution or the thinner each volume bars across the profile Y-axis range. The fewer bars the thinker the volume bars will appear across the volume profiles Y-axis range. To set the number of rows use the ‘Row Size’ parameter.
- Ticks per row allows users to limit the maximum volume displayed on any one bar. The histogram resolution or number of bars automatically adjusts if any single row exceeds the ticks per row specified value. To set the number of ticks per row use the ‘Row Size’ parameter below.
Row Size – Set the ‘number or rows’ or the ‘Ticks per row’ see Rows layout above.
Volume – Volume bars can be color coded to display either both buy and sell volume or just the total volume.
Value Area Volume – Defines the value area range. For the complete definition of the value area see Value area section above). The default setting is 70% but this can be modified here. The bars within the value area are of darker shade, outside the value are is represented with a lighter and transparent shade.
Style
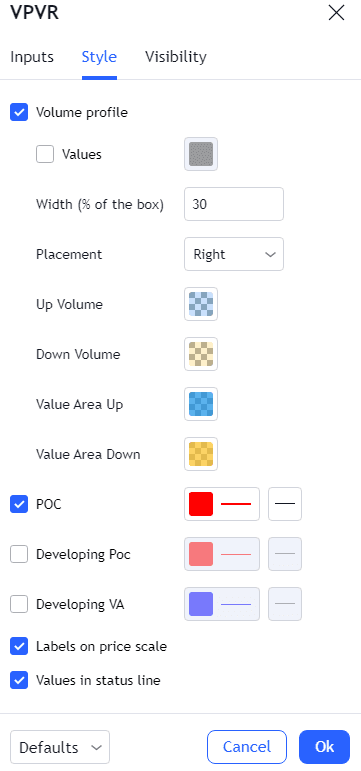
Under ‘Style’ it’s possible to define loads of style preferences. In the table below I’ve provided a description of each of these settings and what they do:
Volume Profile – Here the style for the profile bars can be customized. These include bar colors. placement of bars on the left or right of chart. It’s also possible to display volume data figures. Note: Two figures will appear per bar when ‘Volume’ under ‘Input’ options is set to Up/Down.
POC (Point of Control) – Line color and thickness can be set here. To learn more about what is the POC see Understanding the components of the Volume Profile section above.
Developing Point of Control – The developing POC is a stepped line with breaks that maps the historical track of the POC.
Developing Value Area – Similar to developing POC, this option displays the history of how the current VA of the profile. Represented by the widening or narrowing channel.
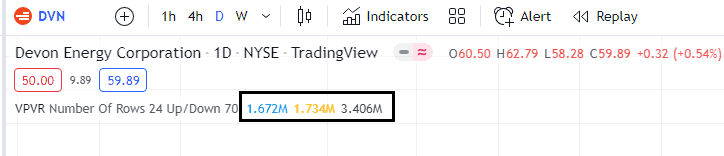
Values in status line – Display Volume Profile values on the indicator legend.
Visibility
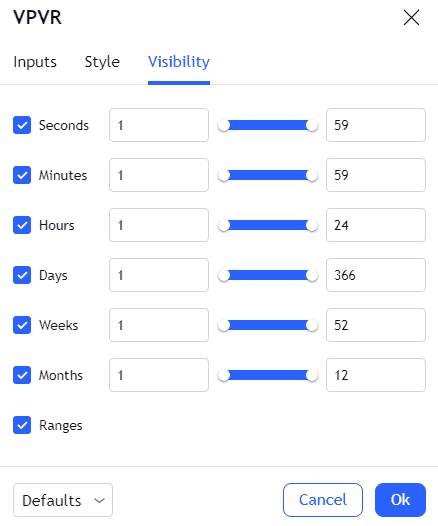
Under Visibility, users can choose the time frames that the VPVR will be visible or invisible by simply ticking or unticking the boxes.
The slider allows for setting specific ranges for each time UNIT:
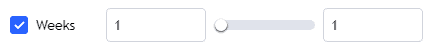
In the example above, the VPVR will be only be invisible in all weekly time frames except the 1 week time frame.
Signup for a Essential, Plus+ or Premium TradingView subscription using the link. *New users get $15 towards a new plan.