In this post I’ll provide a complete overview of Tradingview Log scale charts. I’ll explain what are logarithmic scales and why you might want to consider using them. I’ll also demonstrate step by step how to activate the log scale function in the Tradingview browser and mobile app versions.
What is log scale and linear scale?
Log scale and linear scale within Tradingview are two chart axis scaling methods.
Linear scaling is most common. Linear scaling simply plots axis scale values at equal increments on your chart axis. i.e 1,2,3,4…
Logarithmic scaling uses a multiplication factor referred to as the ‘base’.
Log 10 uses a multiplication factor of 10. This is most common and is often simply abbreviated to ‘log’. All Tradingview logrithmic chart settings use Log (or Log 10).
Log scaling plots axis scale values are spaced at equal increments on the chart axis. At each increment values increase exponentially i.e 1,10,100,1000…
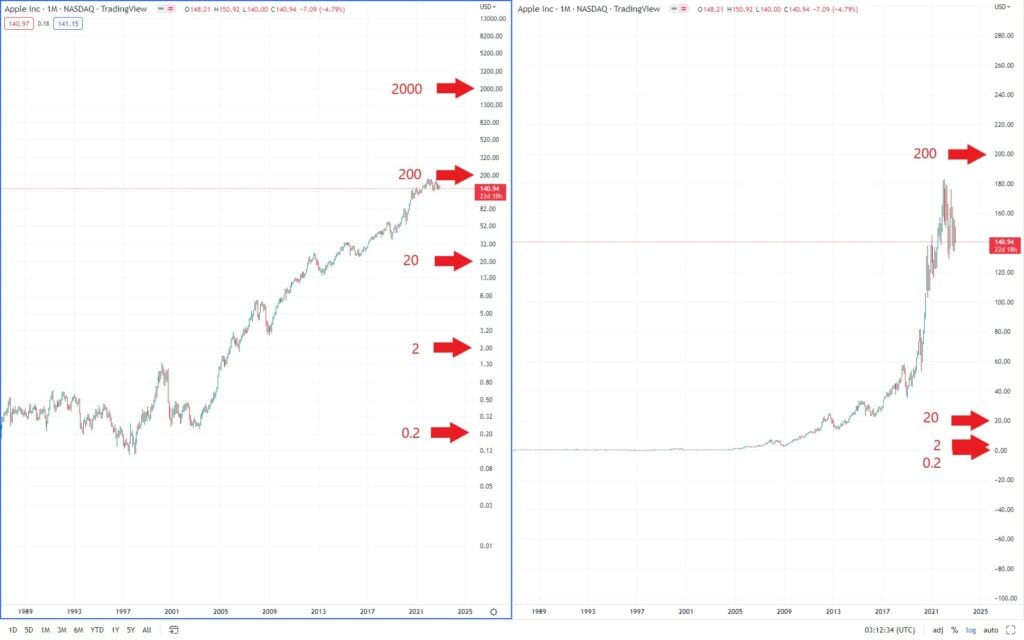
The figure below helps to illustrate the difference:
What is logarithmic scale in TradingView?
Logarithmic scale in Tradingview is a method of scaling the price axis on any chart.
Logarithmic scaling in Tradingview uses Log 10 abbreviated to ‘log’. Log 10 is an exponential function that uses a multiplication factor (referred to as the base) of 10.
Price axis values increase by a multiplication factor of 10 spaced at equal increments.
The chart image comparison above illustrates the differences between linear (traditional) scaling and logarithmic scaling. In the example above the logarithmic chart displays axis values increasing by a factor of 10 spaced at equal increments. i.e 0.2, 2, 20, 200…
In the next section I’ll explain why this is useful and when you might want to consider viewing your charts using Tradingview log scale…
Signup for a Essential, Plus+ or Premium TradingView subscription using the link. *New users get $15 towards a new plan.
Why use Log scale in Tradingview
There are two main reasons why you might want to consider using Tradingview Log scale on your charts.
1. Easier to see relative price change and avoiding loss of price action detail
Avoiding the loss of price action detail on a longer term price chart this is likely the most useful reason to use Tradingview log scale function to view price data.
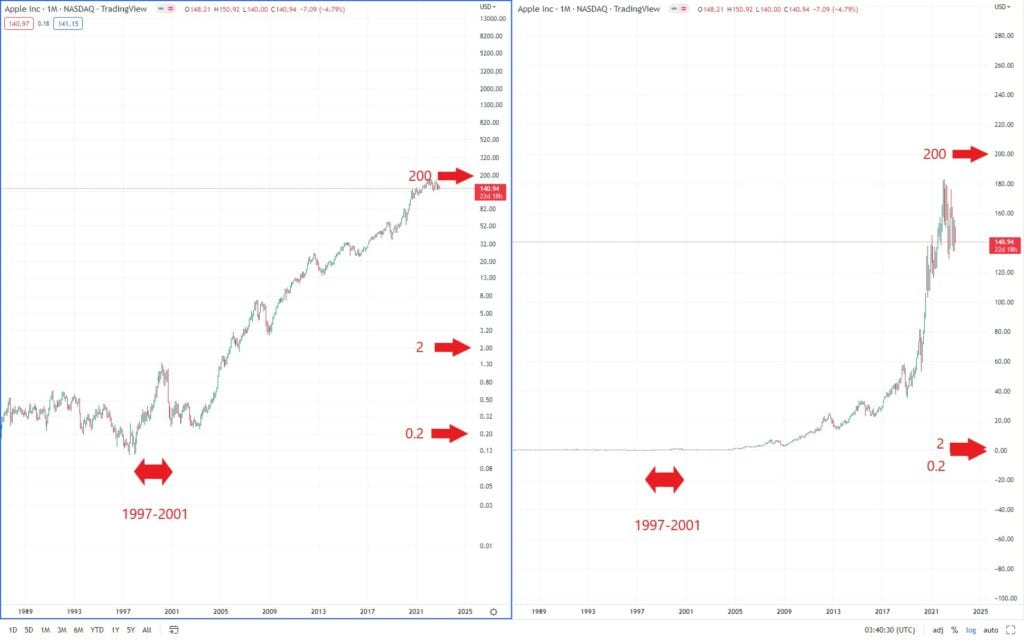
Log scaling makes it significantly easier to observe percentage changes in price over a longer period of time. If the market you are charting has seen significant price increases over a long (potentially short) period of time. Relative price changes at lower historical values are often lost using a linear chart axis (Skewed by more recent higher valuations). Logarithmic scaling makes it much easier to observe relative price changes at lower valuations.
The image below illustrates this benefit of using Tradingview Log scale:
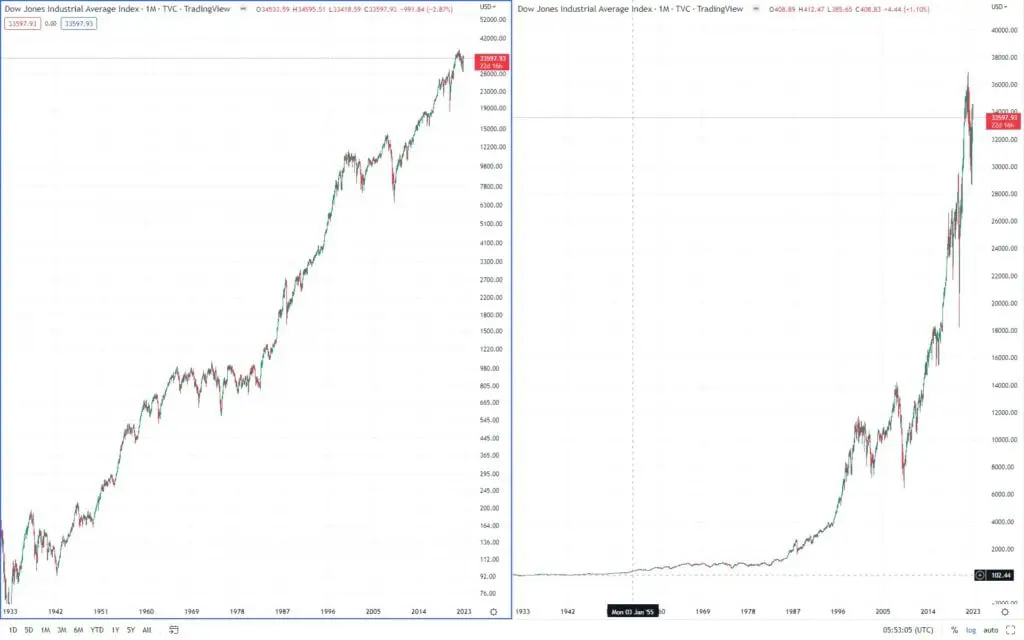
2. Easier to interpret recent steep price action
We tend to expect markets to grow at a percentage grow rate year on year. For example ‘the S&P500 has historically returned approximately 10 percent per year for the last 50 years’. This means that over longer time periods price increases are not linear. Market growth rate is in fact an exponential factor. This makes linear scaled charts appear as if there has been massive recent price increases. This is often deceiving and make it look as if markets are over valued relative to historical prices.
Logarithmic charting allows users to effectively trend growth rates.
Unfortunately Tradingview only offers Log 10 (base 10) logarithmic scaling. That is a growth factor of 10 percent. Never the less using log scaling in can be a useful method for observing price relative to a 10% growth rate.
Using log scale allows uses to see recent price trends from a growth rate perspective relative to historical trends.
How to set log scale in Tradingview?
Setting log scale in your Tradingview charts is simple. The following step by step instructions demonstrate how to setup Logrithmic scale on your chart:
There are two simple methods for switching your Tradingview chart between log and linear scale.
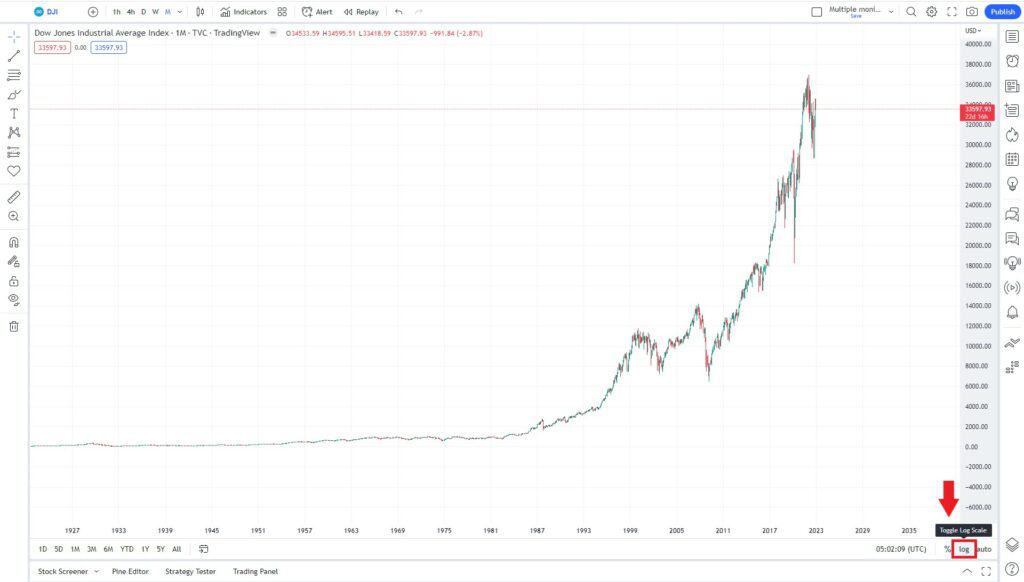
Method 1: On chart button
In the bottom right of any chart click the ‘log’ button. Once to change to log scale on the price axis. click it again if you want to change back to linear scale. If the log scale is active the ‘log’ button will appear a light blue color.
Method 2: Keyboard short cut
If you prefer to use Tradingview keyboard shortcuts then to toggle between log scale and linear scale on the price axis then press Alt + L for PC users and Option + L for Mac users.
How to get Logarithmic chart on Tradingview mobile app?
To get a log chart on the Tradingview mobile app. Follow these steps:
- Open the mobile app and go to the chart icon in the bottom menu
- Select the chart you want to change the scale to Logrithmic
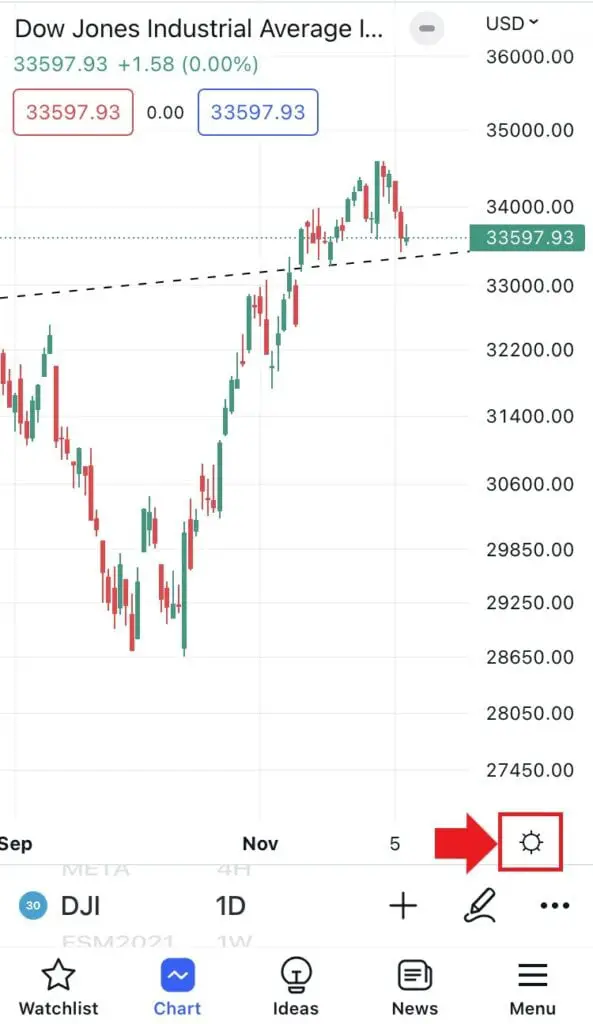
- In the chart bottom right hand corner select the gear icon (see image below)
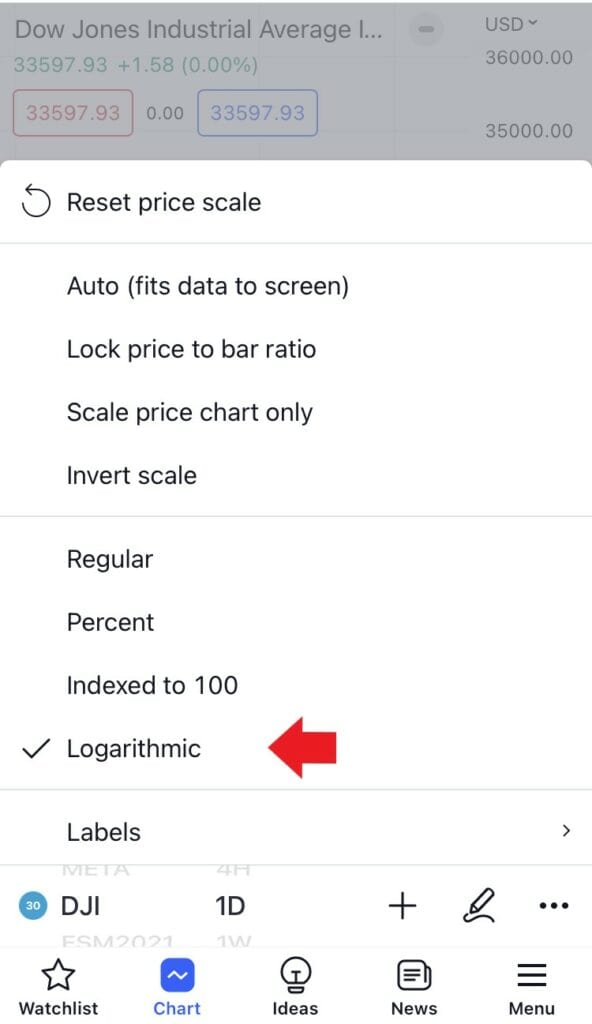
- In the chart settings scroll down till you see the axis scale options and select ‘Logarithmic’ (see image above).
- To switch back to linear (regular) repeat the process but select ‘Regular’.
Signup for a Essential, Plus+ or Premium TradingView subscription using the link. *New users get $15 towards a new plan.