In this post I will provide a detailed guide to the TradingView overlay charts feature and provide a step by step instructions for how use the brilliant tool.
In this post I will also answer some common questions including: How do you compare two charts on Tradingview and how do you overlay charts in TradingView?
Signup for a Essential, Plus+ or Premium TradingView subscription using the link. *New users get $15 towards a new plan.
How do you compare two charts on TradingView?
Trading often requires absorbing and analyzing a rapid stream of data and information.
TradingView solves this common challenge by offering a convenient overlay feature that allows a side-by-side comparison of different instruments on a single chart.
The overlay feature is unique in the trading platform space where other competitors make use of a side-by-side windowed on separated chart.
TradingView’s overlay chart feature offers a more efficient and seamless alternative of doing side-by-side visual comparisons – enhancing the overall user experience.
The following sections explain how to get the most out of this brilliant feature:
How do you overlay charts in TradingView?
In this section, I will discuss the steps in creating an overlay of 2 or more symbols on TradingView.
Quick note on the function we will use to activate the overlay feature
We will be using the ‘Add’ function accessible on the TradingView chart.
The ‘Add’ function shows the new symbol either:
- Overlain directly on the chart of the original symbol or
- Through a new chart panel located below the main chart.
Creating a Tradingview overlay chart
Step 1: Launch TradingView chart
Step 2: Locate the Add (+ icon) on the toolbar > Click this icon
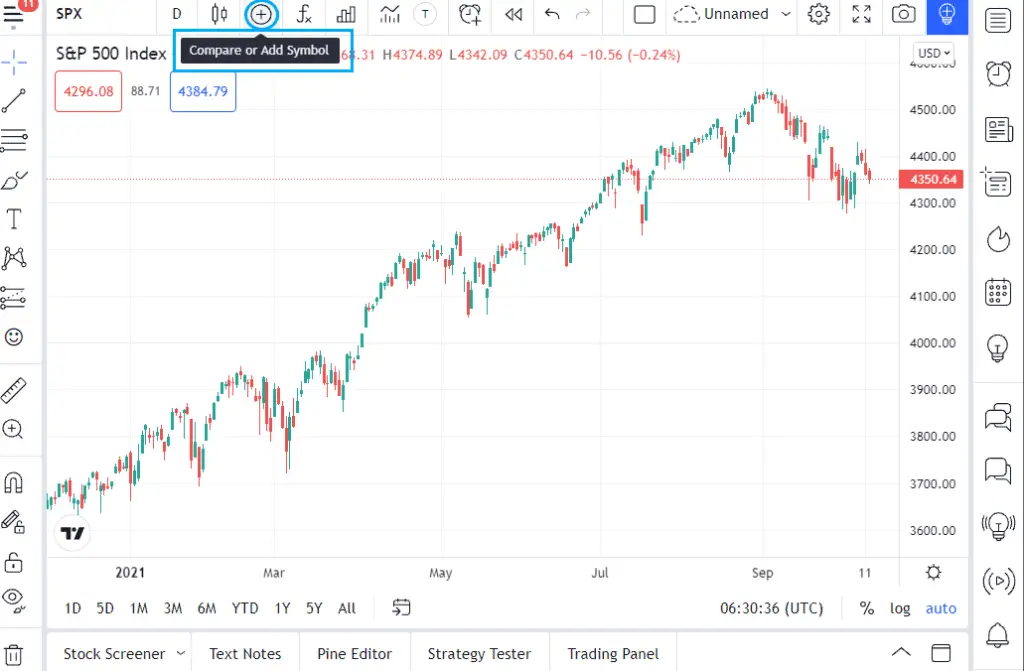
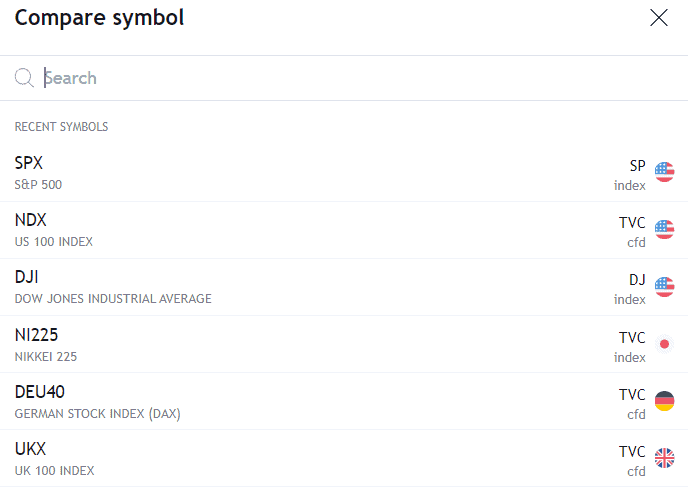
This will open the Compare symbol window. A list of recent symbols will be shown here as well.
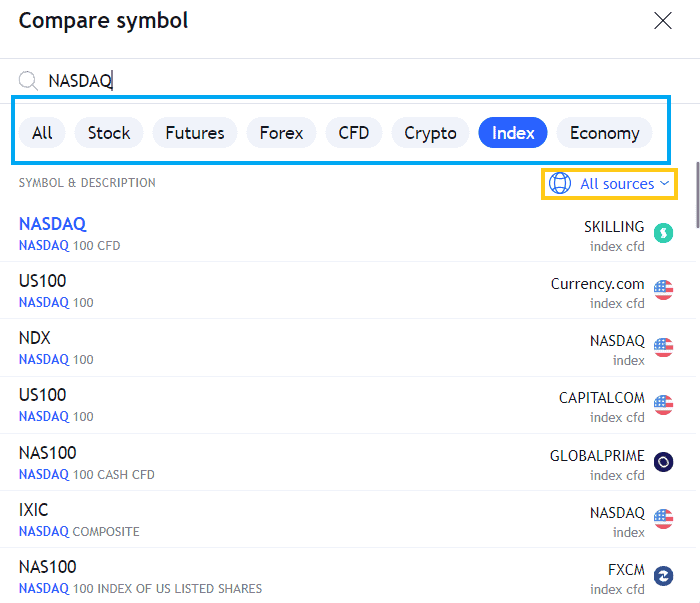
Step 3: In the search bar, type your preferred symbol to Add
TradingView offers asset class filters to help narrow down the list. See blue box below
Alternatively, you can also click on All Sources to select a specific exchange/brokerage filter. See yellow box below.
Step 4: Hover on the symbol > Click one of the options
You will see three options:
- Same % scale
- Y or vertical axis will compare the symbols based on a % basis
- Only one primary Y axis
- New price scale
- 2 or more vertical/Y axes will appear as primary and secondary
- In price basis
- New pane
Newly added symbol will appear in a new pane below with its own axes
Clicking one of the options will automatically add the new symbol on the existing chart.
Repeat the process to add another symbol.
Removing an added symbol
Option 1
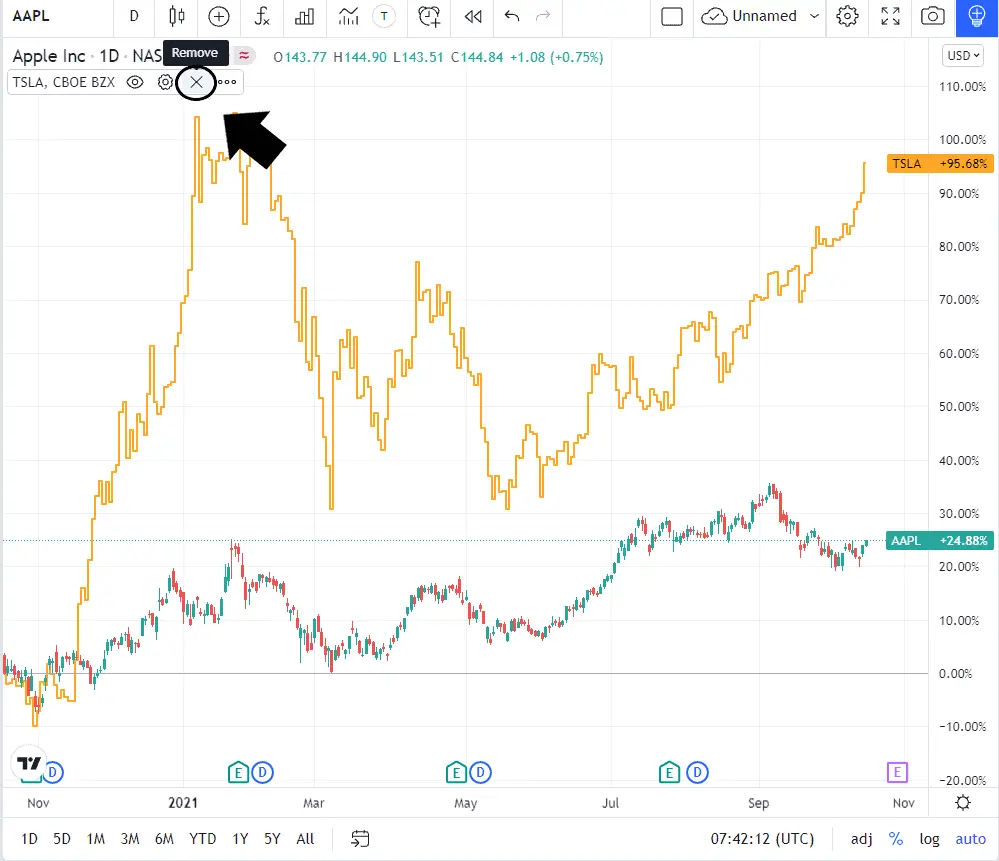
Step 1: From the chart, hover on the added symbol from the upper left
Step 2: Click Remove
Option 2
Step 1: Click on the Add (plus icon) symbol from the main toolbar
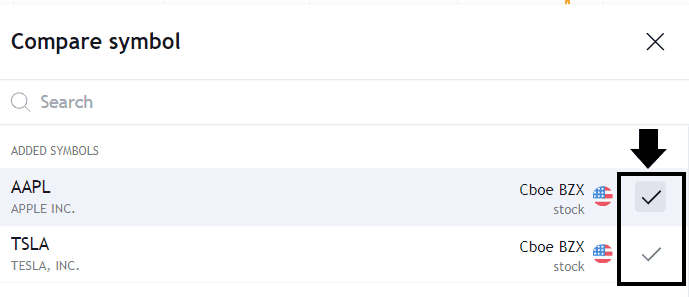
The Compare Symbol window will appear. You will see the active added symbol under ‘Added Symbols‘
Step 2: Uncheck the check mark on the right to remove
Benefits of Tradingview overlay charts
For a purely overlay appearance, select either same % scale or new price scale – This will put the symbol directly over your primary/initial symbol.
This visual offers the following benefits:
- Visual representation of correlations between symbols
- Apples to apples comparison (for same % scale)
- Easily spot major and minor similarities and differences as any deviation from the trend will be visually evident (especially for new price scale).
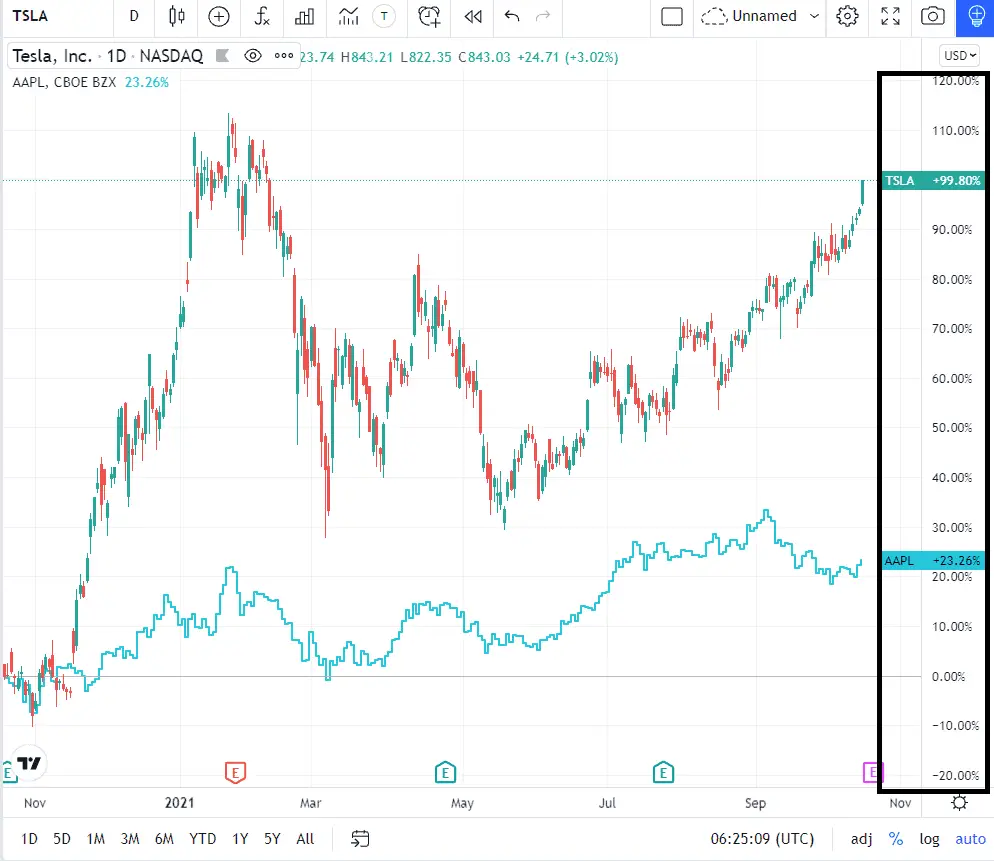
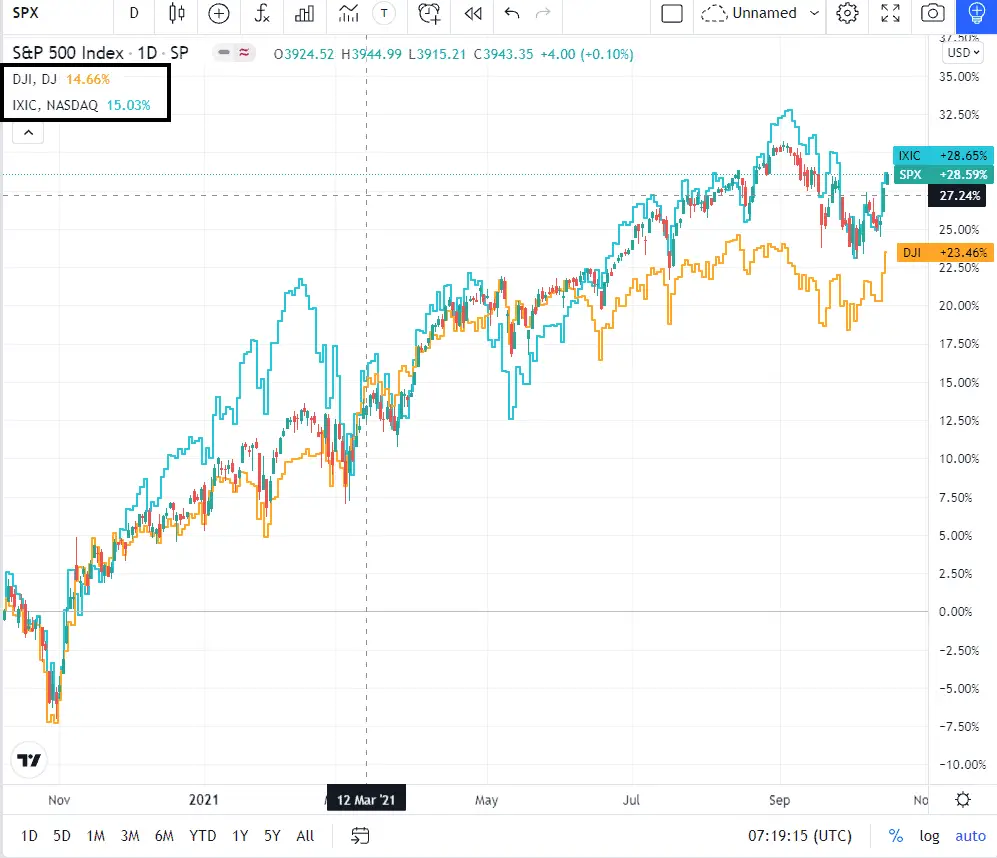
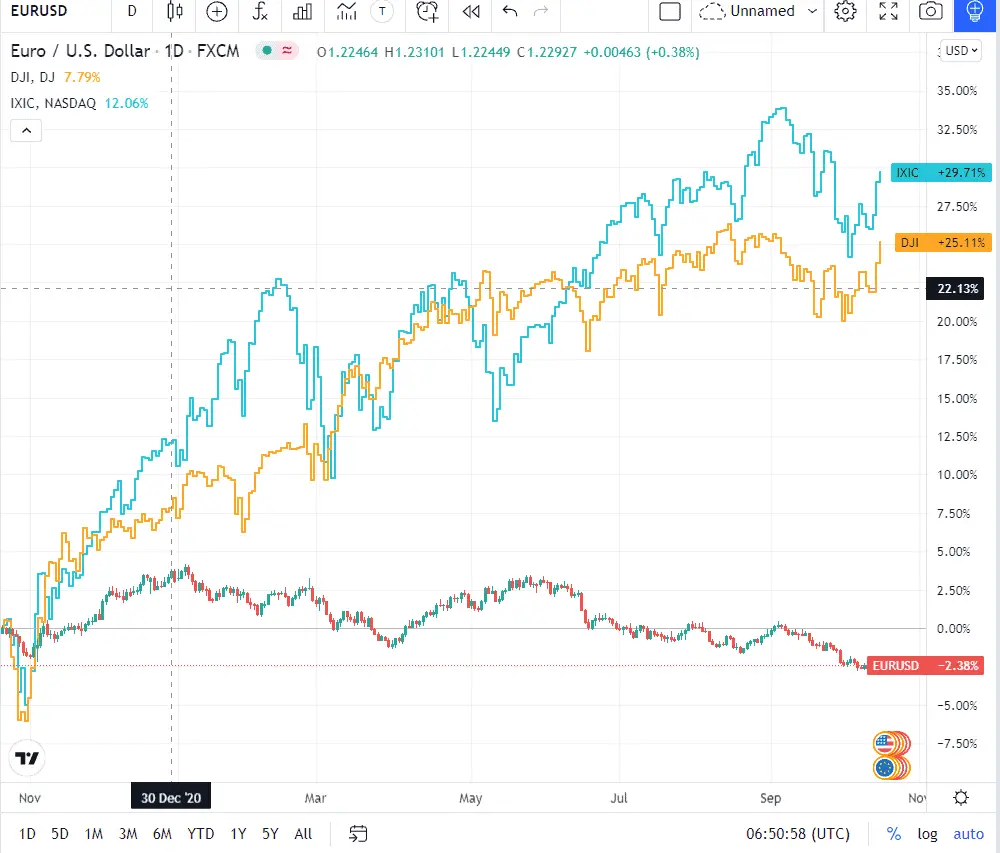
‘Same % scale’
This overlay type is useful in making an apples-to-apples comparison of the price performance of two or more symbols. In the example above, the two symbols show their current price return (%) computed from the price at the first candle appearing on the chart (from the left).
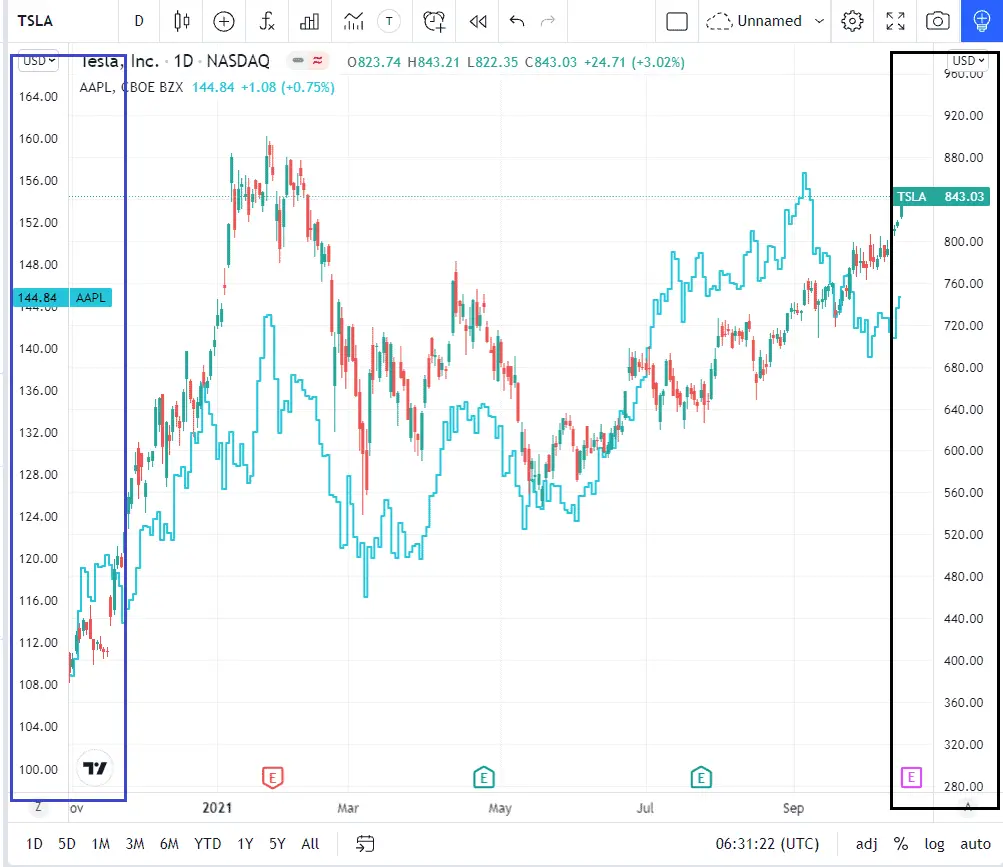
‘New price scale’
This option is very useful in looking for correlation of price patterns. The axes cannot be compared with each other as it represents the price of each individual symbol.
Benefits of Separate chart comparison
In the new pane option, the new symbol will have its own chart pane and dedicated price scale.
This visual offers the following benefits:
- Cleaner and more organized look compared to overlayed symbols
- Especially important when you are comparing more than 2 symbols
- Eliminates confusion of having more than one price scales (see blue, black, purple box above). A new pane will grant the symbol with its dedicated price scale (see screenshot below)
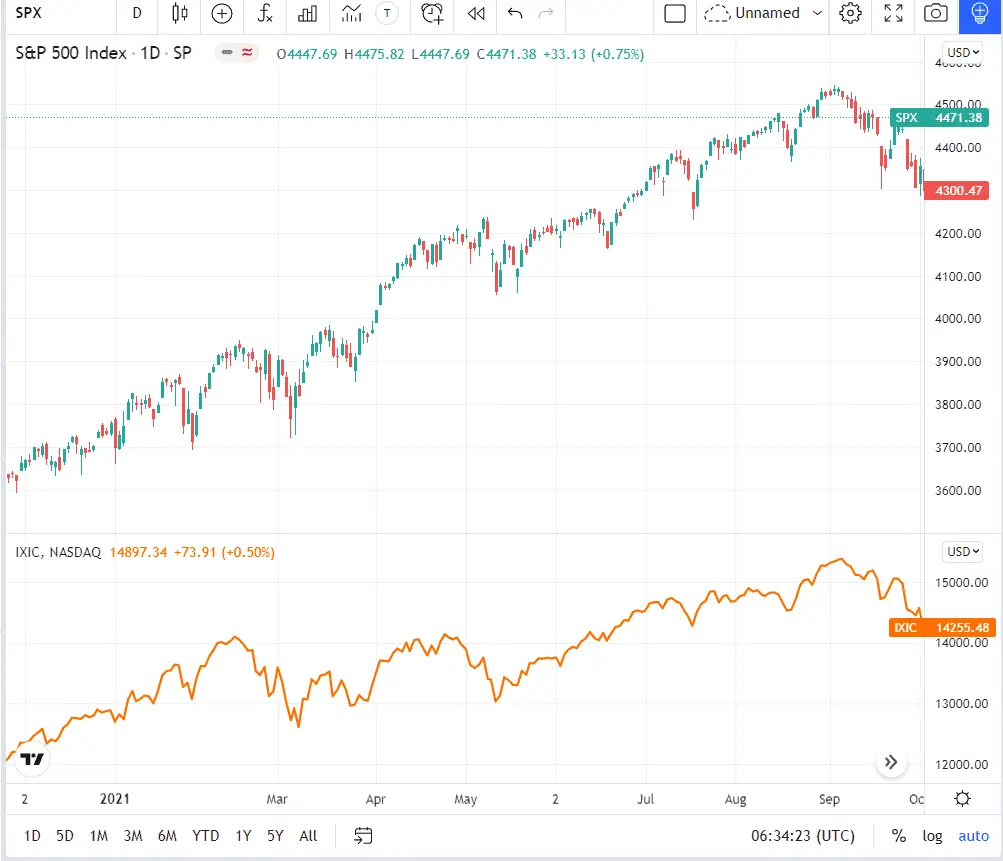
‘New pane’
Cleaner and less cluttered look. Only shows price on the axes, no percentage comparison like same % scale overlay feature. See image above.
Signup for a Essential, Plus+ or Premium TradingView subscription using the link. *New users get $15 towards a new plan.
Overlay chart setting options
By default, the add function will set the new symbol in a line style often in the colors of orange then blue. These can be customized to set your preferences.
How to customize Tradingview overlay charts
To view customizable elements, follow the steps below:
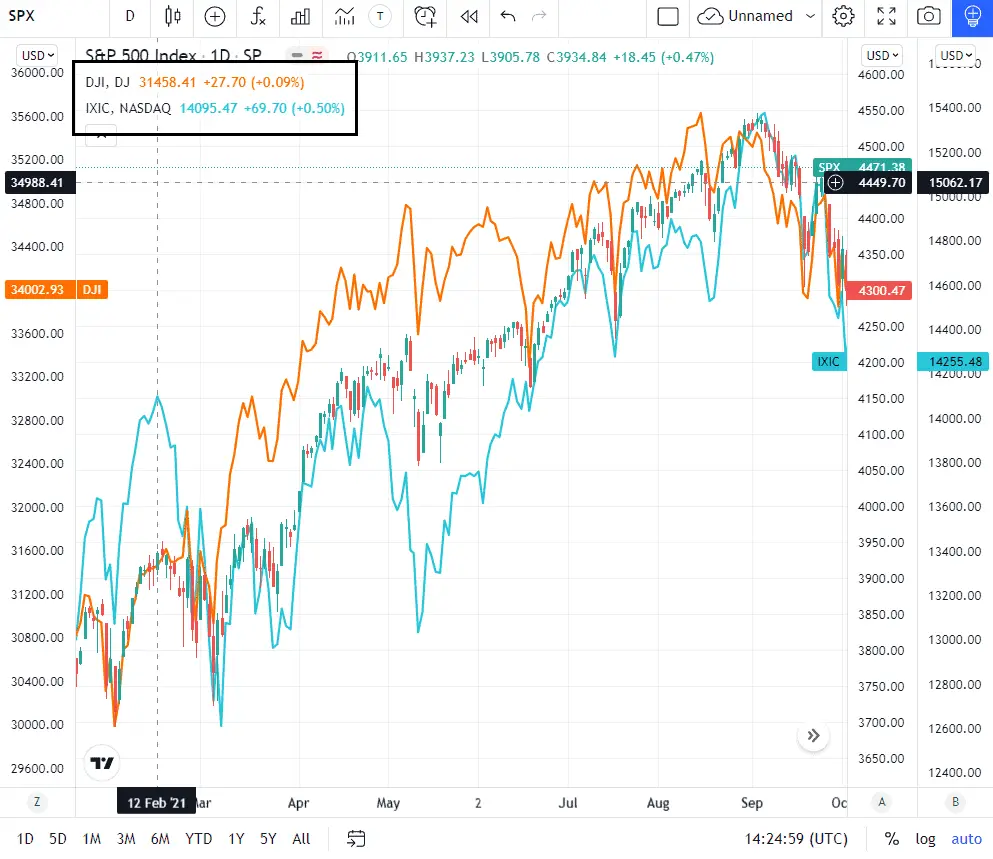
Step 1: At the top left side of the chart, below the original symbol name, you will see a list. See black box below
These are the data series/indicators/symbols that are currently active on your chart.

Step 2: Hover over the symbol you would like to customize
The following icons will appear:
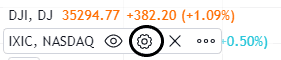
Step 3: Click the gear icon (settings). The Custom preference window will appear
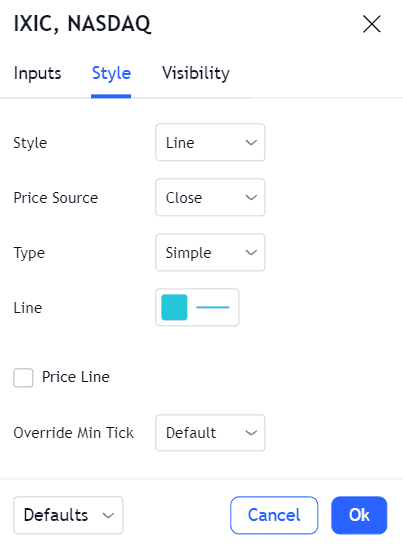
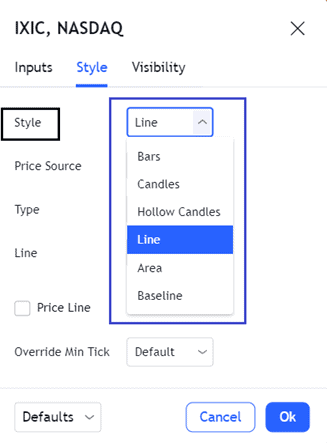
Step 4 [changing data series style]: Click the down arrow in each of the fields to open drop down menu
Step 4. 1: Select from the options provided. See blue box below
Step 4.2: Some options may have added customizable elements. Adjust accordingly.
Step 4.2: Click OK
Note: Same method applies for changing other custom elements.
Saving as default
To avoid having to change default settings repeatedly, it is convenient to save your preferences as a default. This is a great feature if you frequently compare and correlate instruments.
To save a default setting – After adjusting your preferences:
- Do not click Ok yet
- Locate the button labeled as Defaults. Usually located at the bottom to the left of the Cancel and Ok button
- Click down arrow > click Save as Default
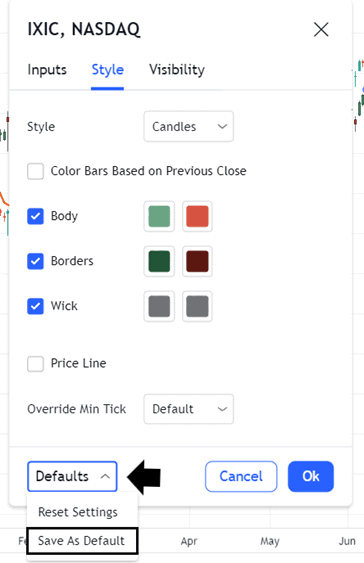
- Click OK
Applying default settings
Saving defaults will include all applied preferences on the chart. This includes the following elements: added symbols, style, and visibility.
The new saved default will automatically apply to your chart. No other step necessary to apply the default.
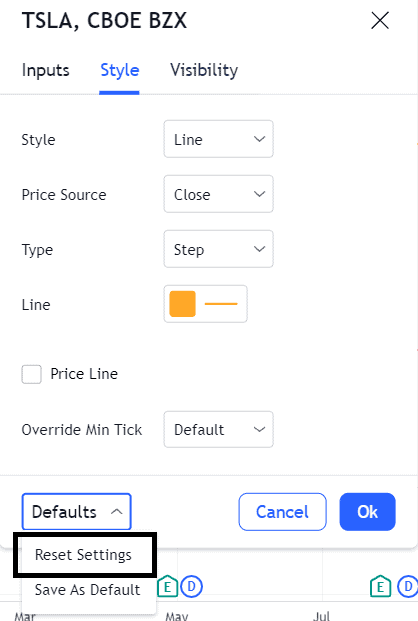
Resetting to default settings
If you would like to delete and revert to the original TradingView default settings.
From the Custom preference window:
- Click down arrow in the default button on the bottom left
- Click Reset Settings
- Click OK
Considerations when saving Tradingview overlay chart defaults
You can save different default preferences for each of the symbols you added. For overlay symbols – These settings aren’t set as default for an individual instrument. Instead are set to the instrument in the order it is added.
For example, the first added symbol (DJI) below will have as default a line-step style in orange; the second added symbol (IXIC) will have as default a line-step in blue.
When we open a fresh chart, then we add one new symbol. This is how your chart with the saved default settings look like:
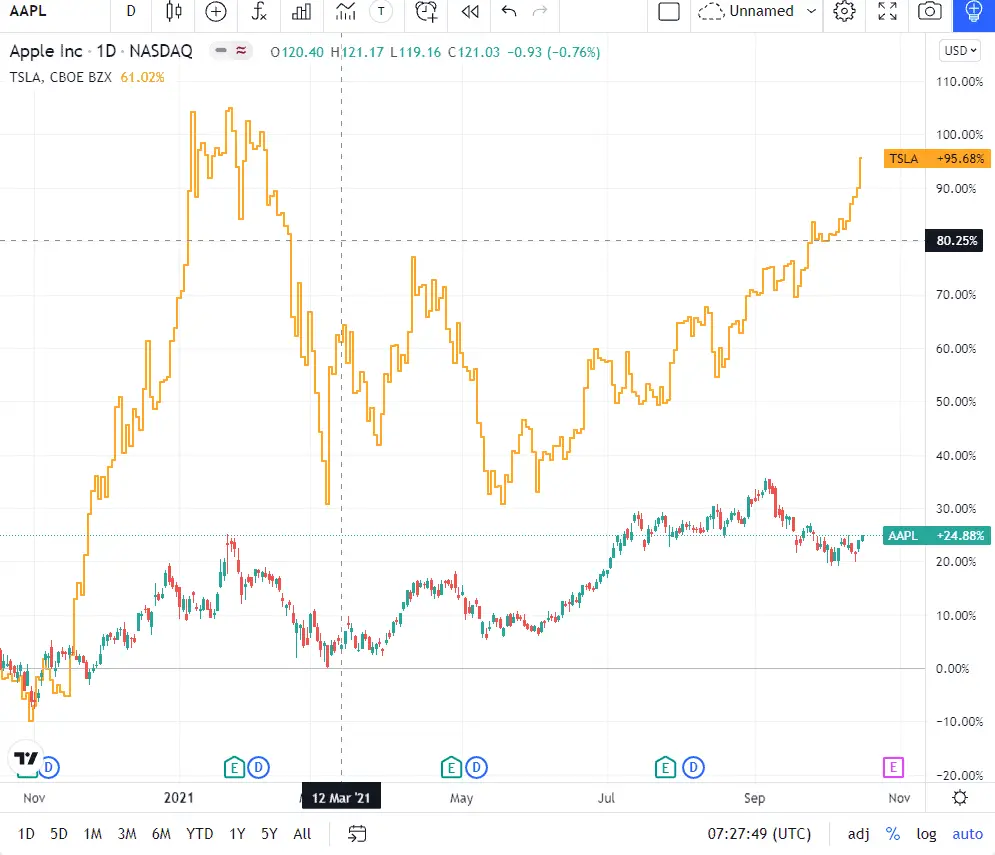
The default for first added symbol (previously DJI) will be applied to TSLA
Saved default will apply to any chart and symbol
Even when you open a new chart with new instrument or asset class, the added symbols from your default settings will automatically be added to that chart.
Signup for a Essential, Plus+ or Premium TradingView subscription using the link. *New users get $15 towards a new plan.