In this post I provide a complete guide to Tradingview Heikin Ashi charts. This guide is perfect for anyone interested in learning more Heikin Ashi Tradingview charts.
In this guide I’ll introduce Heikin Ashi Tradingview charts. I’ll explain why you might want to consider using Heikkin Ashi charts. How they are calculated and also how to setup Heikin Ashi charts in Tradingview.
Signup for a Essential, Plus+ or Premium TradingView subscription using the link. *New users get $15 towards a new plan.
What are Heikin Ashi charts
Heikin Ashi charts derive themselves from traditional candle stick charts. They are time period based charts. The candle structure has a body and wicks (in the case of candles) and the candle (or bar) has a Open, Close, High and Low.
Heikin Ashi charts where originally developed in Japan. The word ‘Heikin’ translates to ‘Average’ and ‘Ashi’ translates to “Pace’. So Heikin Ashi literal translation means the average pace of price moment.
Note: Tradingview Heikin Ashi charts currently only offer candle stick charting for Heikin Ashi charting and don’t offer a bar charting.
The difference between traditional candles sticks and Heikin Ashi charts in the method for calculating the Open and Close values that define the candle (or bar) structure. To learn more about how Heikin Ashi Open and Close values are calculated see ‘How are Heikin Ashi candles calculated section below’.
In short the Heikin Ashi Open price in calculated from the average price of the previous bars Open and Close. This calculation has the affect of smoothing price trends and eliminating noise and short term volatility.
Signup for a Essential, Plus+ or Premium TradingView subscription using the link. *New users get $15 towards a new plan.
Candlestick Charts Versus Heikin Ashi Charts
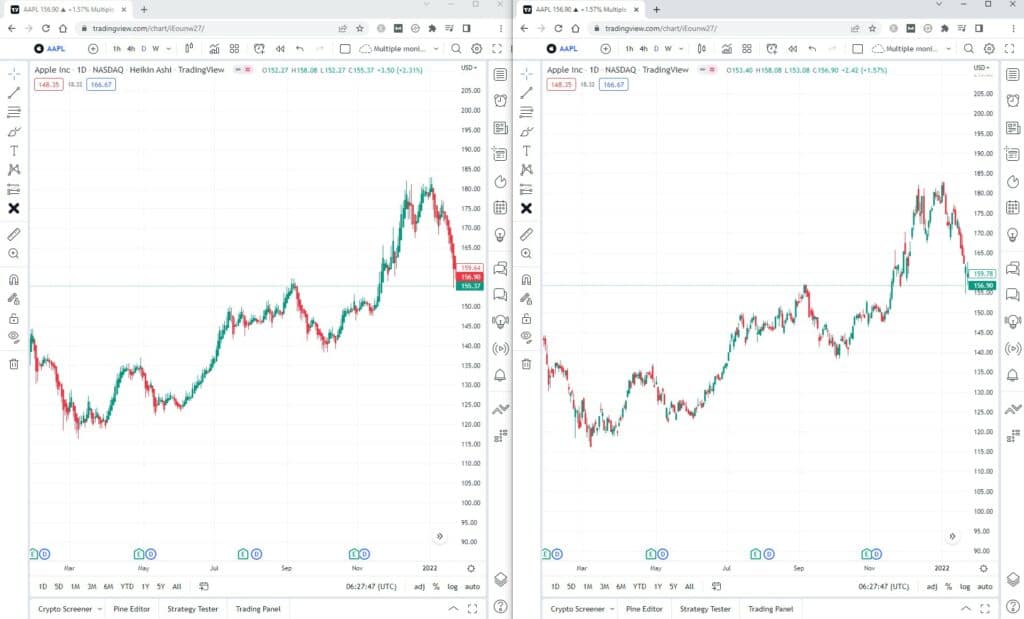
The visual difference between traditional candle stick charts and Tradingview Heikin Ashi charts is traditional candle stick charts display the raw price information. Candle stick charts display the Open price, The Close price and the High and Low for a specific time period.
This provides the most detailed price information for a specified period of time. Traditional candle stick charts also display the most volatility and noise.
Heikin Ashi charts display visually much different. Heikin Ashi charts tend to trend more. That is a predominant uptrend they display more green candles than a traditional candle stick chart. The candle bodies appear smoother and the wicks are different (typically longer). Heikin Ashi charts shows the same information but averages it out.
Why use Heikin Ashi on your Tradingview charts
Depending on what sort of trader you are will determine whether you might consider using Heikin Ashi charts.
If you are a long term trader you might like how Heikin Ashi charts smooth long term price trend patterns and make them clearer and easier to identify.
If you are a shorter term trader then eliminating noise may help you make less reactive decisions for getting into and out of positions.
However if you are a trader that likes to see every price of information then traditional candlestick or similar chart is probably a better option.
How are Heikin Ashi candles calculated
Heikin Ashi (like traditional candle stick charts) are created from four pieces of information. These components are the OHLC (Open, High, Low and Close). Each of these pieces of information determine the size, shape and color of the candle.
The following formulas are used to calculate each of these components:
Open: Is calculated from the average of the open and close from the PREVIOUS candle: Open = (Previous candle Open + Previous candle Close) / 2
Close: Is calculated from the average of all four components of the CURRENT candle: Close = (Open + High + Low + Close) / 4.
High: The highest value of the current bars time frame or Open or Close.
Low: The lowest value of the current bars time frame or Open or Close.
Heikin Ashi price versus real price
If you compare the price axis of Heikin Ashi chart to a traditional candle stick chart you will notice that the current price shown in each chart is different. This is because the Heikin Ashi current price is displayed as a pending close value. The Heikin Ashi current price is calculated the same the close price:
Current Heikin Ashi price: Is calculated from the average of all four components of the CURRENT candle: Current Heikin Ashi Price = (Open + High + Low + Current Price) / 4.
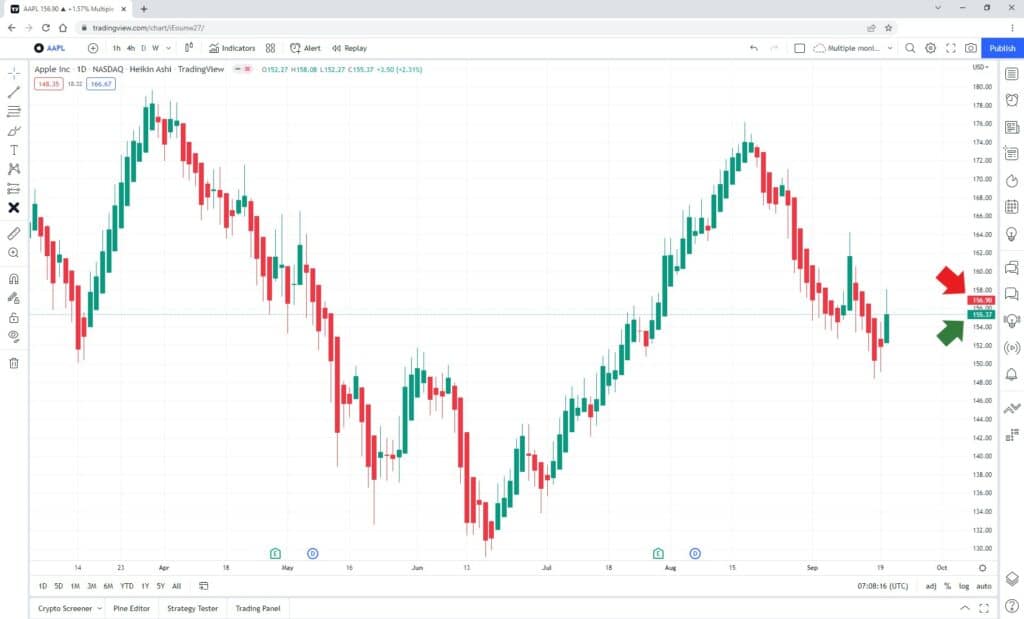
Tradingview will display both the Heikin Ashi price and real current price in the right chart axis. See Heikin Ashi Tradingview chart settings section below for more information.
Signup for a Essential, Plus+ or Premium TradingView subscription using the link. *New users get $15 towards a new plan.
How do I setup Heikin Ashi charts in Tradingview?
Setting up Heikin Ashi charts in Tradingview is really simple. To setup the charts follow the instruction below:
To convert to Heikin Ashi chart in Tradingview.
- Open any chart with your preferred instrument
- Go to the top chart menu and left click on the candles icon
- In the drop down menu scroll down to ‘Heikin Ashi’.
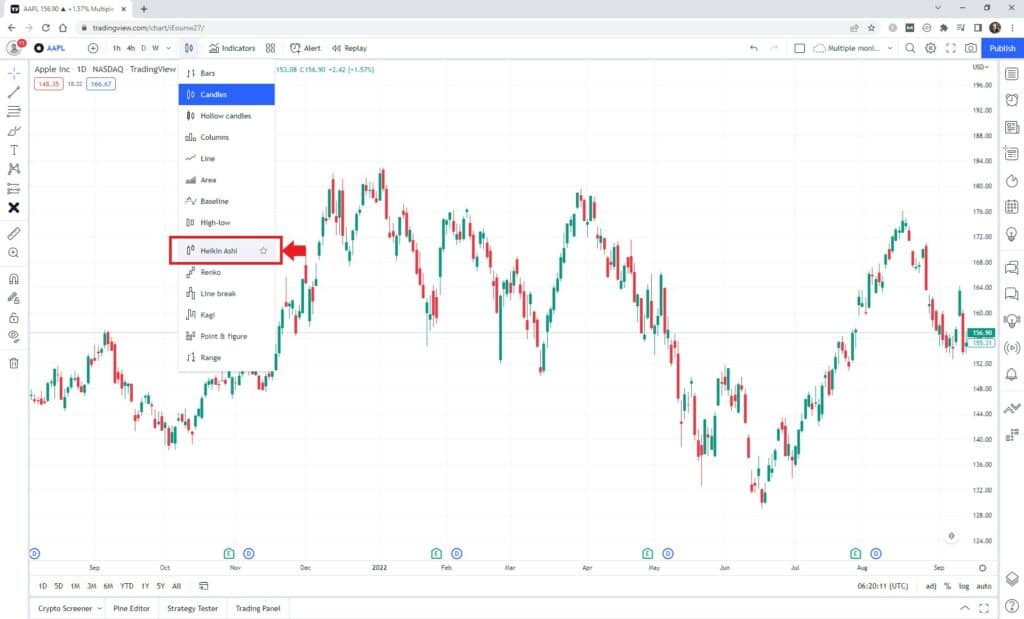
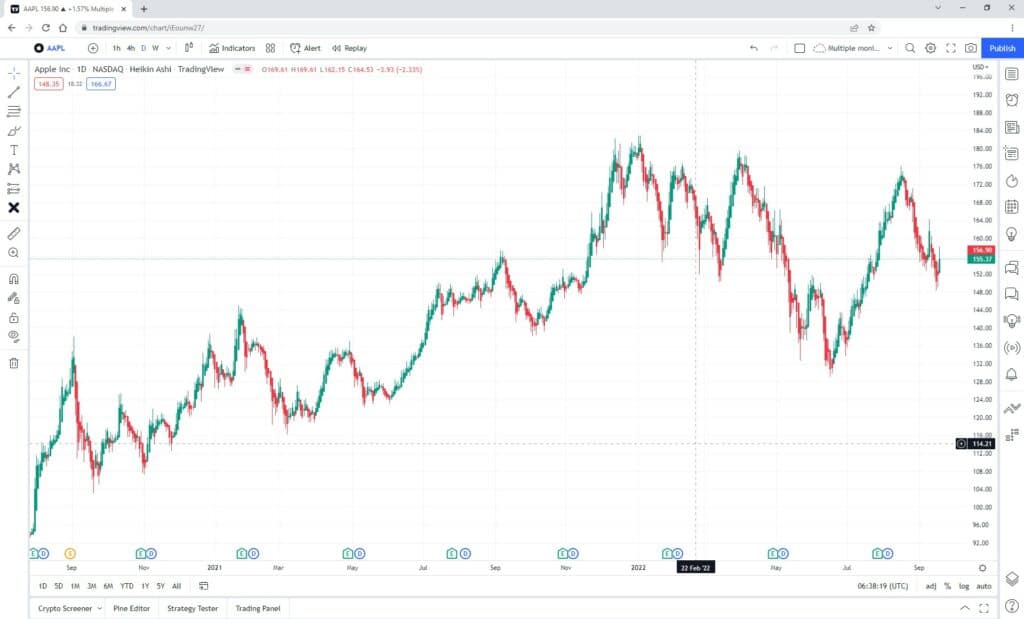
- Your chart will now convert to Heikin Ashi candles.
Heikin Ashi Tradingview chart settings
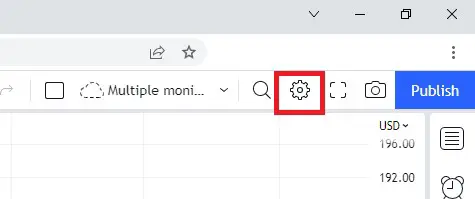
To change any of the chart settings for your Tradingview Heikin Ashi chart either left click on the chart and select the settings option (gear icon) or on the right of the top chart menu select the gear icon (settings).
The settings for Heikin Ashi charts in Tradingview are mostly identical to candle stick charts. The only additional setting is the option to ‘Show real price scale (instead of Heikin Ashi price)’.
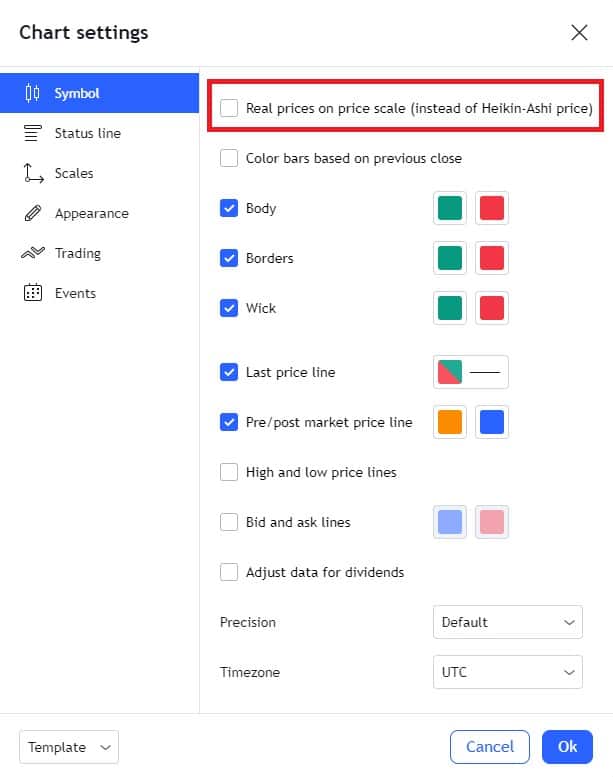
By default Tradingview will display both the Heikin Ashi price (green) and the current price (red) in the right price axis. To only display the real current price select the box ‘Show real price scale (instead of Heikin Ashi price)’ option.
To learn more about the difference between real price and Heikin Ashi price see the ‘How are Heikin Ashi candles calculated’ section above.
Signup for a Essential, Plus+ or Premium TradingView subscription using the link. *New users get $15 towards a new plan.