A trading journal takes many forms. Now a days there’s a huge variety of trading journal options available. Many of the best are software solutions that allow traders to import broker data and analyse this data via various charting options. Many of these solutions require a significant investment. In this post I’ll share what I think is the best free trading journal solutions.
The best free trading journal solutions worth notable mention are: TradeInsights a free online software. Alternatively an excellent create your own free trading journal option is to use Evernote in combination with microsoft excel or google sheets.
In this post, I’ll explore these journals in more detail and explain why these journals are great free options for traders looking to keep their operating costs to a minimum.
TradeInsights
TradeInsights is a fantastic option for traders who are looking for a free all in one software journal solution.
Although the TradeInsights interface can be deceivingly basic, TradeInsights does a fine job in executing the essential functions of a complete trading journal.
TradeInsights offers easy trade data entry plus a great range of performance reports with filtering and tagging available. TradeInsights offers many features normally only available with paid trade journal solutions. Which is why I rate it the single best all in one free trade journal option.
TradeInSights Features
The following is a list of features offered by TradeInsights:
Trade Details
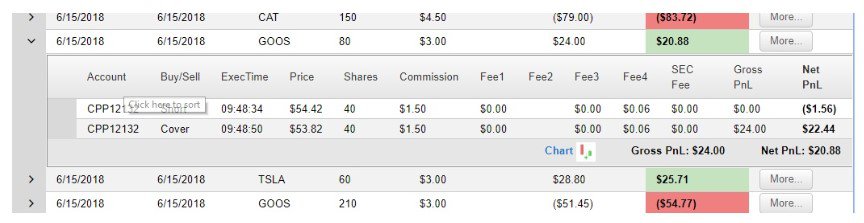
- Breaks down all trading data for every trade into a well organised table.
- Automatic calculation of gross and net P&L (automatically deducts commissions and fees)
- Easy customization of data fields with an easy to use filter tool.
- Detailed data fields for individual entries, exits, quantities, fees, and the corresponding gross/net P&L
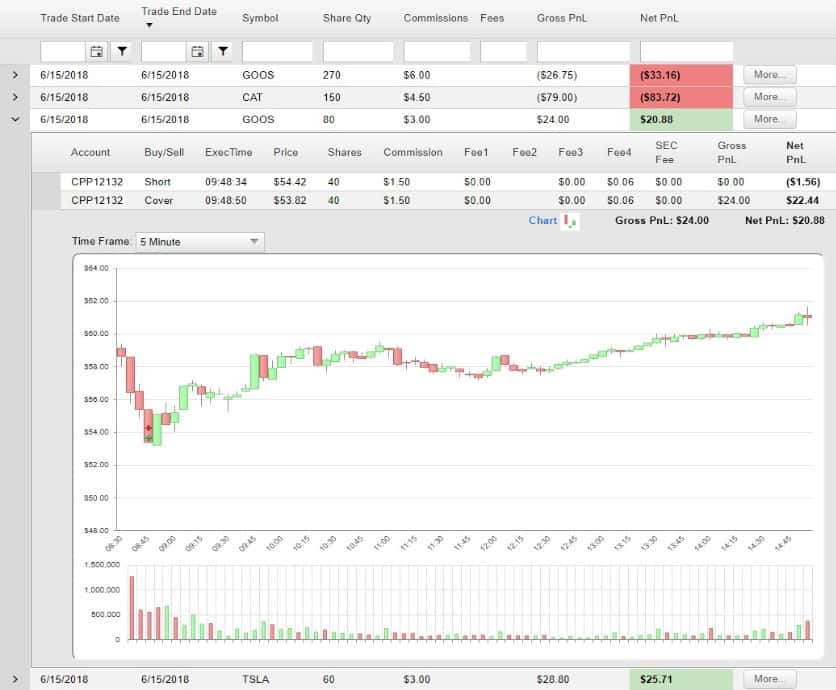
- In ‘chart view’, entries and exit prices are plotted directly on a in journal chart. Hovering at the price levels will reveal specific details of the trade (includes gross/net P&L)
Broker Integration and list of brokers supported by TradeInSights
Import trades from selected brokers to do away with manual inputs
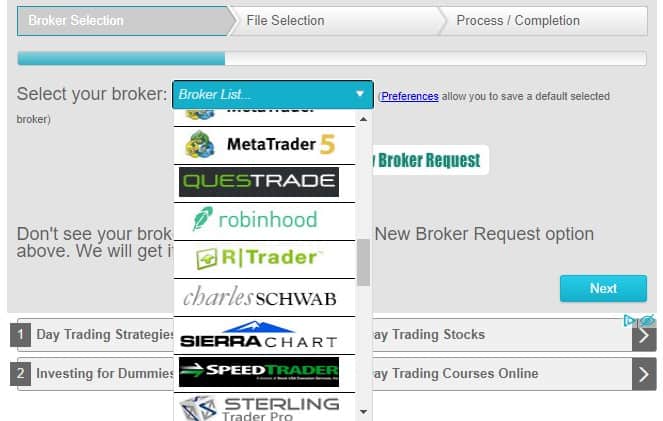
List of brokers and platforms supported by TradeInSights:
- Alaric Trader
- Ally
- Aurora
- Binance
- Capital.com
- Centerpoint
- Colmex Pro
- CME Group
- DAS Trader Pro
- E-Trade
- Fidelity
- Fusion DMA
- JFD Brokers
- Lightspeed
- Merill Edge
- Ninjatrader
- MetaTrader
- MetaTrader 5
- Quest Trade
- Robinhood
- R Trader
- Charles Schwab
- Sierra Chart
- Speed Trader
- Sterling Trader Pro
- Stock USA
- Suretrader
- Trader Group LLC
- Tasty works
- TC2000
- Ameritrade
- Think or Swim
- TEFS Trader
- Tradenet
- Tradestation
- trade Zero
- trading Sim
- Tradeovate
- United Traders
- Warrior Trading
- Webull
Easy and powerful Journaling
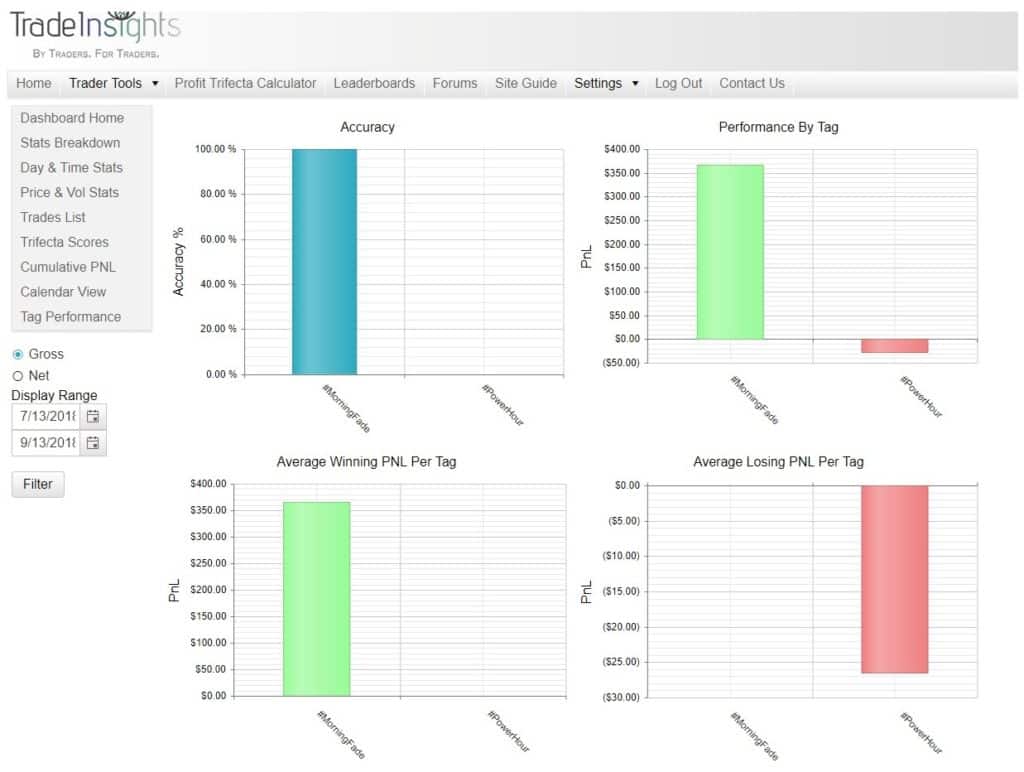
- Trade tagging helps identify and filter trades. Tags offer a huge amount of customization for TradeInSights users. The objective of tagging is to bunch trades together for comparative and performance analysis. For example, strategies or trade setups use common tags. Analysis of individual tags details the performance of any single strategy/trade setup.
- Calendar view offers a broad overview of monthly performance. You can view the trades executed on any one day by clicking on each date.
Performance and Status Reports
TradeInsights offers a huge range of charts and table options available to report trade data.
Sample reports include:
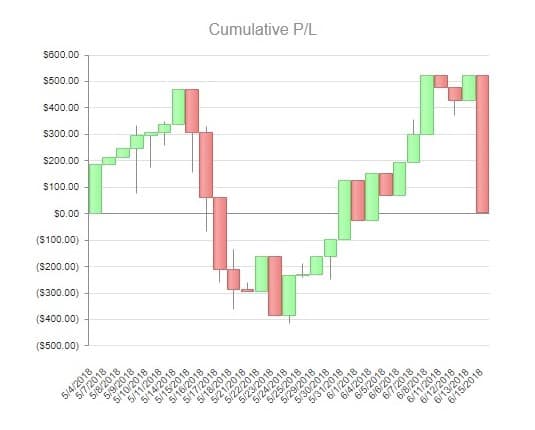
P/L on a cumulative basis (equity curve) – Track profit/losses ($) accumulated on winning / lossing trades
Daily profits and losses – View gain/loss chart to help visualize and compare daily performance
Tag/Setups Performance – View and analyze performance metrics of customized tags (see example below)
Time/Day-related metrics – Identify hours of the day or days of the week that generated the best returns
Comprehensive stats on green days versus red days – Stats include winning/losing trade count, total volume, breakdown of P&L, largest win/loss, even total commissions and fees.
TradeInSights Advantages and Disadvantages
| Pros |
- 100% Free
- Broker integration allows for importation of data
- Tagging system
- Charting software integrated in the website; no need to open another window to view charts
| Cons |
- Simple interface scores low in the aesthetics department
- Limited range of reporting options compared to those offered by paid journals
- Steep learning curve that may be off putting for beginners.
Create your Own Trading Journal
Evernote
Many traders prefer to build their own journal. Building your own journal offers endless opportunities for customization. Handwritten journals are fine but they lack the ease of analysis and filtering options available with software solutions.
If you prefer to create your own trade journal, a great option is Evernote. Evernote is perfect for detailed note taking. Evernote has a sleek and intuitive design. Journal enters can be easily organized with filter and tagging options.
Evernote is an online notebook that you can access anywhere – from your smartphone, desktop to the web, your notes are synced on all your devices.
Evernote Features
Intuitive Interface
- Sleek design – One of the reasons for Evernote’s huge popularity partly due to its sleek and simple to use interface.
- Simple to use – Navigating through functions and features is easy. Complexities are kept to a minimum
- Easy to learn – Learning curve is fast compared to other trade journal options
State-of-the-art note organization
There are two ways to effectively organize trades:
Notebooks
- Categorize all things trading into different notebooks to keep notes sorted and organized. Example of notebook classifications could be: Watch list, Trade Logs, Playbook, Study materials, Trade Performance, Thoughts
Tags
- Evernote offers up to 100,000 tags per account giving users more than a handful of ways to assign keywords to categorize trades. Example tag options could be: Assign tags based on status (open/closed position); result (win/loss), trade setup (momentum), asset class (futures, equities)
- Evernotes power lies in its ability to easily retrieve notes associated with the same tag via a list of filter tags options.
Excellent Data Presentation
- Evernote allows for the insert tables to organize data and information
- Evernote also offers a wide range of free templates. Great to help beginners build a journal structure when starting out.
Skitch
Skitch is An add-on feature tool that takes screenshots and adds them directly to your Evernote journal.
- Annotations can also be done on the screenshot.
- This feature is particularly helpful when you want to include your annotated charts to your journal
Device integration made easy
Evernote syncs your data to all your registered devices. Whether you view your notebooks from your phone or laptop, the same sleek user interface will greet you along with all the set of tools
Evernote Advantages and Disadvantages
| Pros |
- Absolute flexibility to build your own trade journal
- Tagging allows instant retrieval of specific trades
- Availability of templates**
| Cons |
- No arithmetic capabilities. Can’t make any performance analysis on trade data*
- Compared to TradeInsights, Evernote is predominantly manual work
- Does not offer importation of brokerage data
*Tip: Data manipulation and analytics can be done via Excel or google sheets. You can then link the specific notebook to the spreadsheet for easy access.
**Note: As of writing, Evernote does not have a trade journal template. A tip, however, is you can find a template that resembles that of a journal (e.g. “Build a Plan”)
Spreadsheet Journals
Spreadsheet software such as Microsoft excel or google sheets function as data organization and analytics tools.
Microsoft Excel, is a hugely popular software application. Likely you already have Microsoft office installed on your machine. It features fantastic computational capacity, graphing and pivot tables – making it a must-have piece of software for a variety of applications.
Google Sheets has gained similar popularity in recent times. Goggle sheets shares the same computational capabilities as Excel. Google sheets is exclusively a web based application that lets users syncs files real time to its file storage application. The advantage of google sheets over excel is its free to use with a google account.
Both Microsoft excel and Google sheets spreadsheets organize data with the use of cells, rows and columns. Both also boast of a wide range of formulas and charting features that you can use for data manipulation and presentation.
Either spreadsheet application can be used to make a highly analytical trading journal where you can record, compile, and examine statistics of trade performance.
The advantage of using either Excel or google sheets to build a trading journal is the limitless customization. Although there are templates available, by using spreadsheets you have complete control over the design and components of your journal.
Building a trading journal using spreadsheets
Necessary Trade Journal Components
To make your trading journal robust and complete, consider having these must-haves:
- Entry Price
- Exit Price
- Target Price
- Stop Price
- Trade Time/Date
- Risk
- Return
- Risk/Reward Ratio
- Mistakes
- Notes
You can learn more about these necessary components in my recent post: Best Online Trading Journal – What should be included in a trading journal.
What makes spreadsheets an excellent trade journal?
As mentioned above, data manipulation and statistical analysis will be the game changer of your trade journal. Developing to be a consistently profitable trader – like any competitive sport, requires continuous and detailed data recording and performance analysis via review – something which spreadsheets such as google sheets and excel are perfect.
Trading Journal example
Whilst there’s no standard way to create a trading journal. The following is an example of my own trading journal. I divide my own journal into two main parts: Trade Log and Trade Analysis.
These two parts works in tandem.
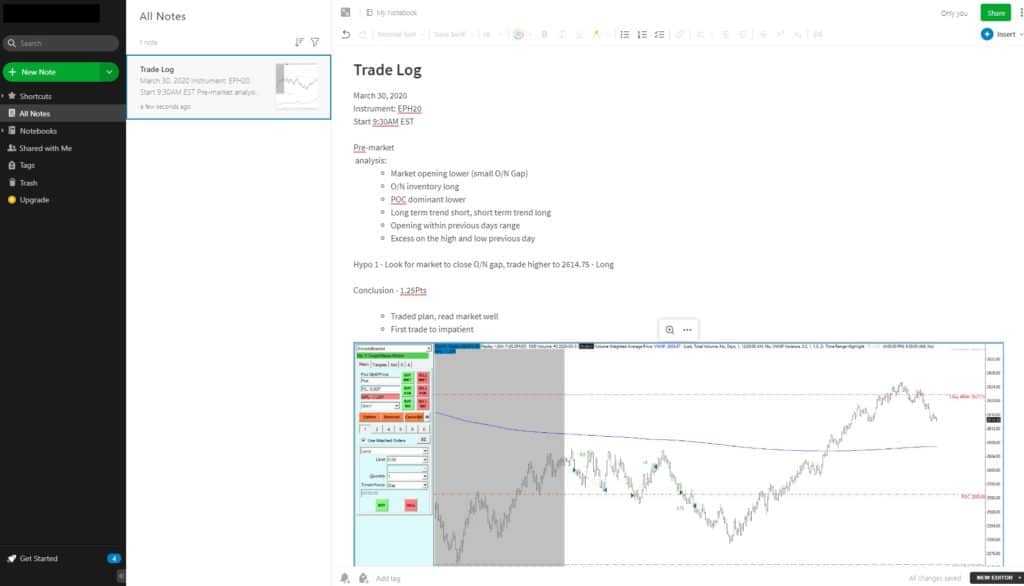
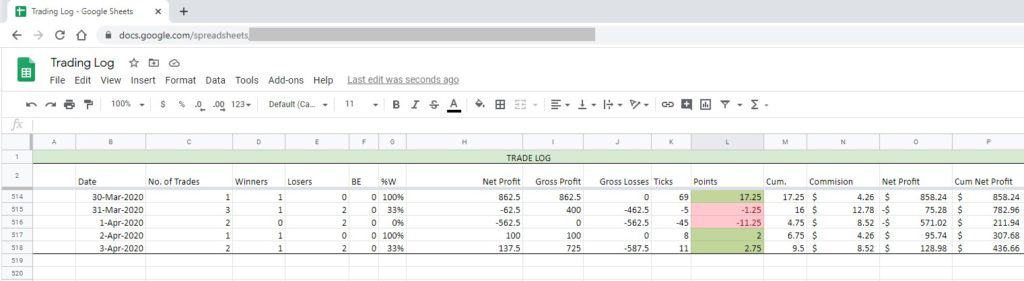
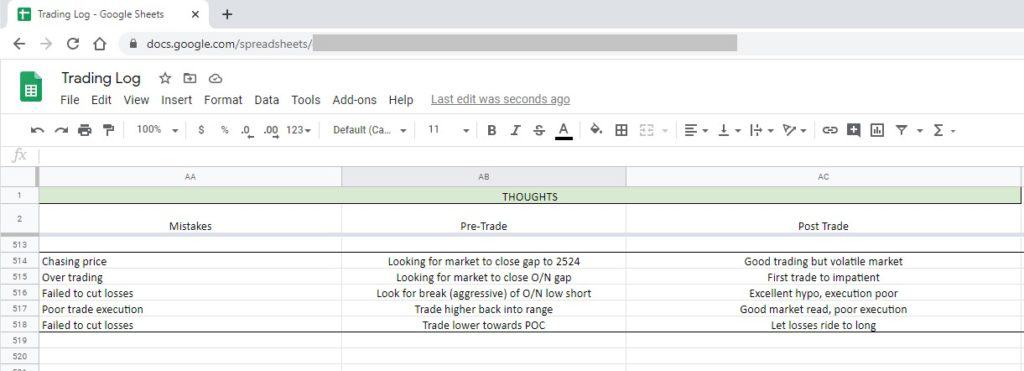
Trade Log – is a strict record of trades. These can be either individual trades or a days trading record with notes. Its a really good idea to including word-based data such as mistakes and thoughts.
See this basic Trade Log sample below:
Trade Analysis – Is a summary style record of statistics that can include metrics such as win/loss ratio, average risk reward, total number of trades, total PnL, total mistakes, etc
See this sample Trade Analysis below:
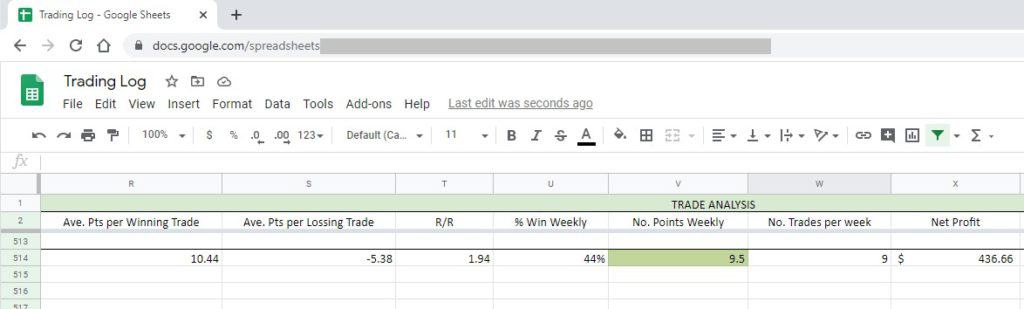
Using spreadsheets its simple to generate formulas to automatically generate outputs.
In the above example, all computations of performance metrics are automatically generated and are based on data from the Trade Log.
Remember, there is no one size fits all in building a trade journal. The design will be up to the preference of the user. The important part is the inclusion of the journal elements we mentioned above.
Spreadsheet Functions that work well for Trade Journals
Formulas: Automate arithmetic by using a wide range of formulas
- Sample Application: Automating computation of gains/losses, AVERAGE for means of winning/losing trades
Conditional Formatting: Highlight data fields by setting a criterion
- Sample Application: Red fills for negative results (i.e. losses)
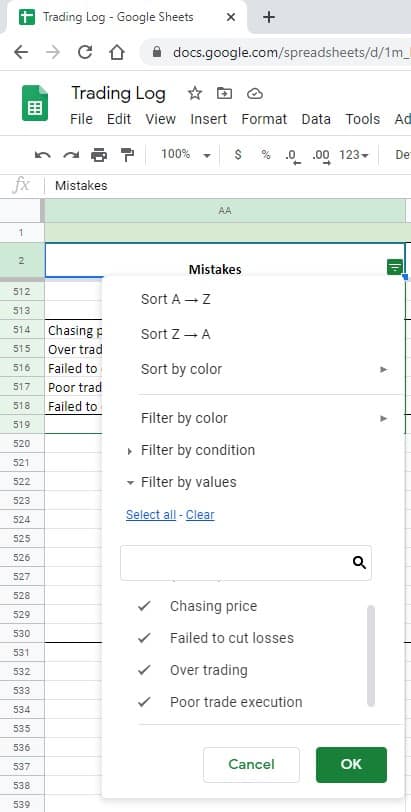
Filter Tool: Set filters on certain columns to focus on certain trades
- Sample Application: Apply a filter to track actual losses accrued for Mistakes committed
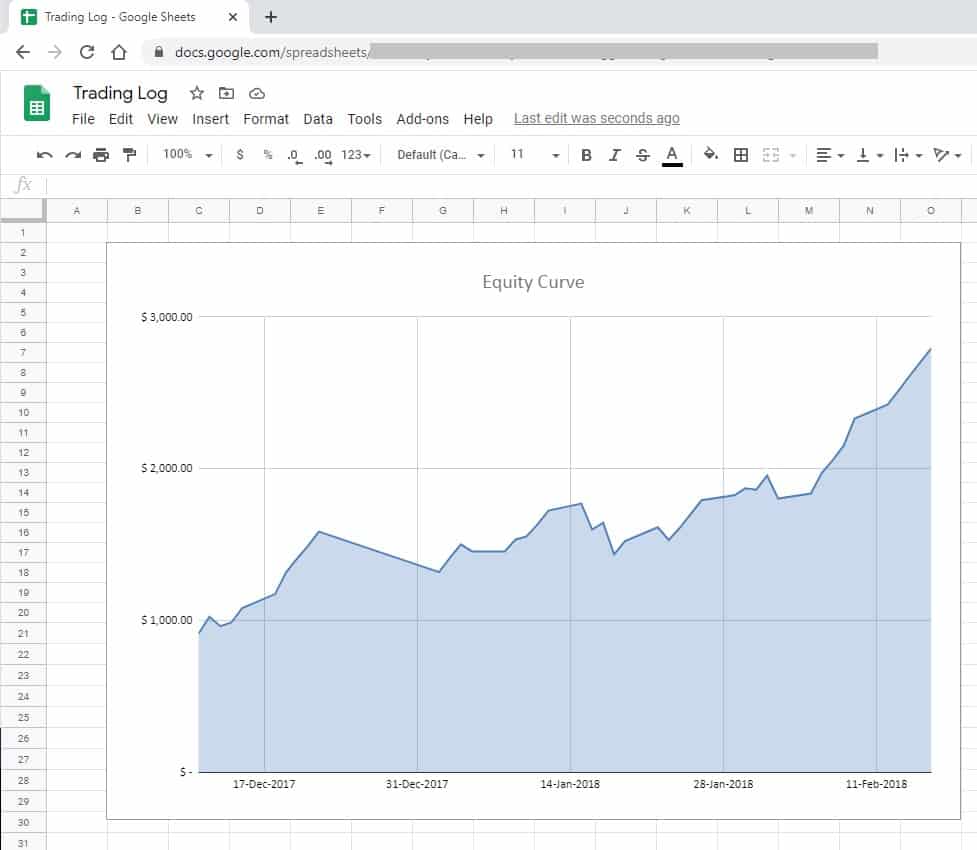
Charting Tool: Even more important is the charting capabilities of spreadsheets. Plot data points from your trade log/analysis to see performance trends.
- Sample Application: P&L, Net equity value, P&L of flagged mistakes
Spreadsheet Advantages and Disadvantages
| Pros |
- Data sorting and calculations – allows for automated calculations
- Highly customizable – include metrics that are most relevant to your needs
- Charting capabilities – all you need is a set of data points
- Filtering and conditional formatting capabilities – not as innovative as tagging, but can be maneuvered to fit the job
| Cons |
- Limited flexibility and options in note writing
- Standard user interface
- Tagging is unavailable
Evernote and Excel
An excellent trading journal solutions is to use Evernote and a spreadsheet in tandem – where Evernote will be utilized for note taking while Excel or google sheets for computational and analytical work.
These two applications work excellent together offsetting each other’s disadvantages.
Linking Excel or Google sheets and Evernote
Linking a specific Evernote notebook to a specific trade entry in your spreadsheet workbook is fairly easy. Simply copy the URL of the evernote notebook then paste > keep source formatting on the chosen cell in Excel or Google sheets.
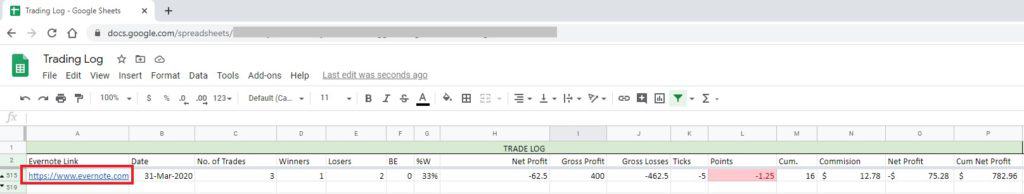
Clicking the link inside the red box above will open a web browser tab directed to the Evernote notebook