Tradingview has become my go to trading analysis platform primarily because it offers clear, clear and simple to use charting. Tradingview candlestick charts are intuitive to customize and manipulate on the chart.
In this post I will provide a simple guide to setting up and configuring Tradingview candlestick charting on the platform!
Signup for a Essential, Plus+ or Premium TradingView subscription using the link. *New users get $15 towards a new plan.
Does TradingView have candlestick charts?
Yes, TradingView offers various chart types including candlesticks. In addition to Japanese candlesticks, other types include bar, line, and hollow candles.
All these chart types are free and customizable to suit varying preferences.
In this post, I’ll drill down on common questions relating to Tradingview candlestick charts.
What are candlestick charts in TradingView?
Candlestick charts are perhaps the most widely used and recognizable charting methods today. Tradingview offers candlestick charts as standard with the platform. Tradingview candlestick charts are highly customizible, they look clean, display information clearly and look great!
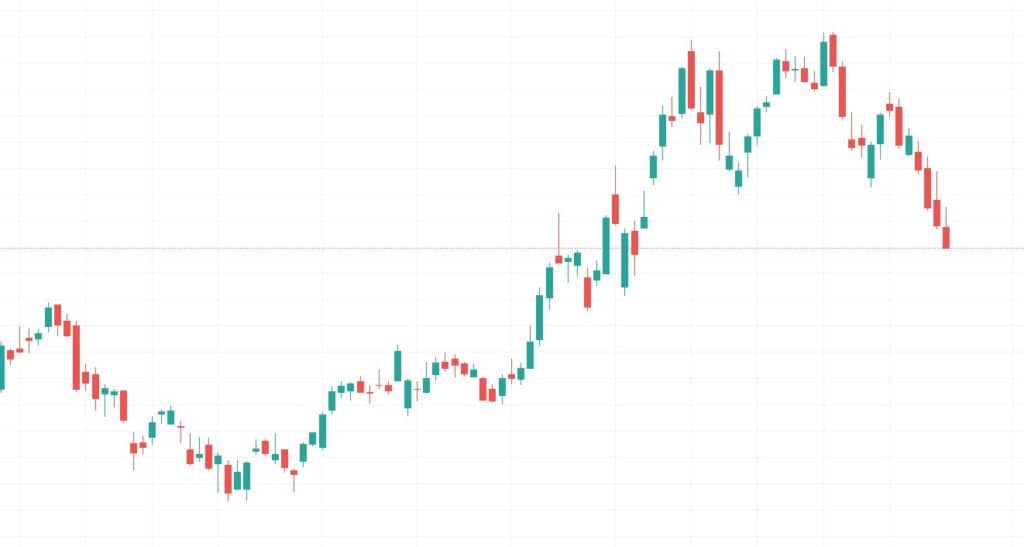
For those of you not familiar with candlestick charts; Candlestick charts have been around for over a century. Originating in Japan, candlestick charts are popularly known as effective visual tools that map price movement over time.
The main use of candlesticks is to display four price points in a single bar – open, close, high, and low.
The length of the candle’s body represents the distance between the open and the closing price, while the length of each of the wicks (top and bottom) represents the distance of the high and lows from the open and close prices.
How to use TradingView candlestick charts?
TradingView charts are highly customizable. Most features of the charts can be edited to a user preference.
If you’d like your chart data to display in candlestick format the following sections explain how to do this:
How do you get the candlestick chart in TradingView?
Getting a candlestick chart is free and is a ready-to-use feature to all users – regardless of account level.
All you need to do is to select candles as your preferred chart type. This can be quickly done through the main toolbar.
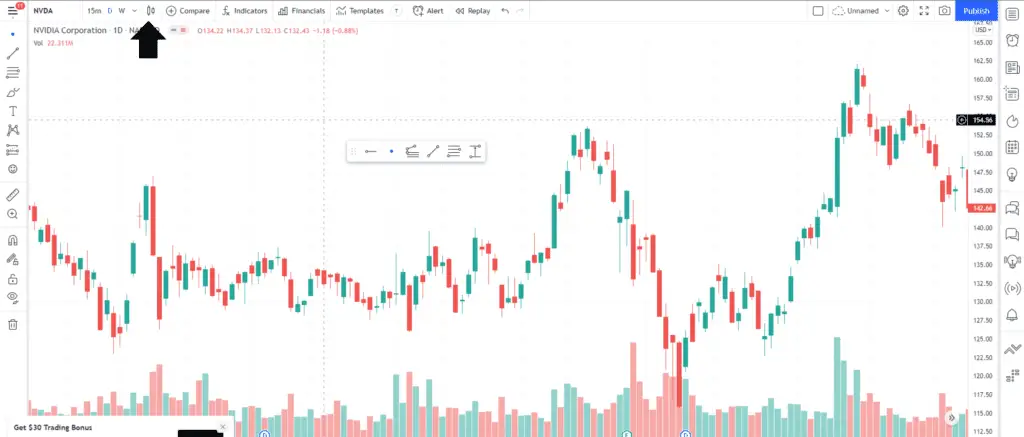
Step 1: Launch TradingView chart
Step 2: From the main toolbar, beside the timeframe options, click the chart type icon (See arrow below).
A closer look:

Step 3: Click the chart type menu icon A drop down of chart types will appear
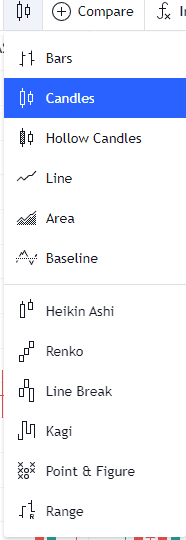
Step 2.2: Select Candles
This will instantly convert your chart into a candlestick chart.
How do I change the color of my candlestick in TradingView?
One of the customizable elements is the candle colors.
By default, this is set to red for down days (closing price < opening price), green for up days (closing price > opening price). However, you can change the color of the up/gain candles and/or down/loss candle.
Here’s how you can change the color of your candles:
Step 1: Launch chart
Step 2: On the upper right corner, click Chart settings (denoted in gear icon).
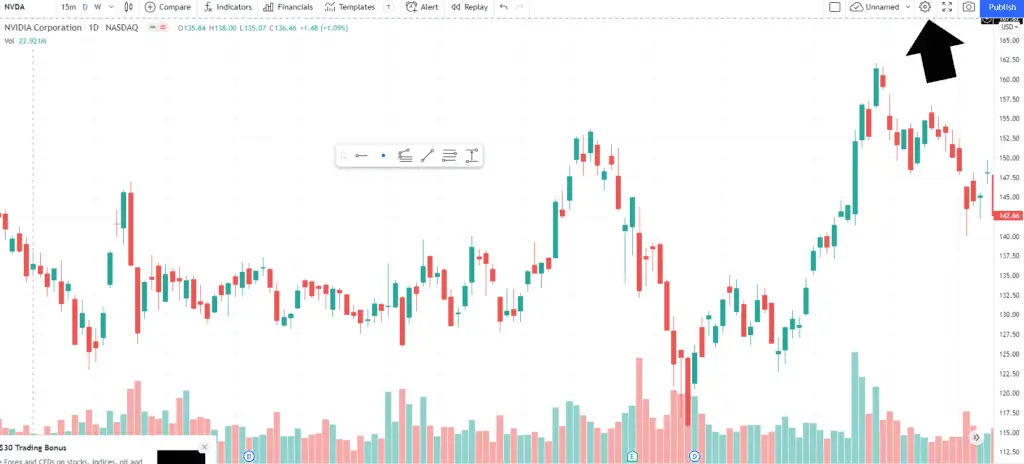
This will launch the chart settings window.
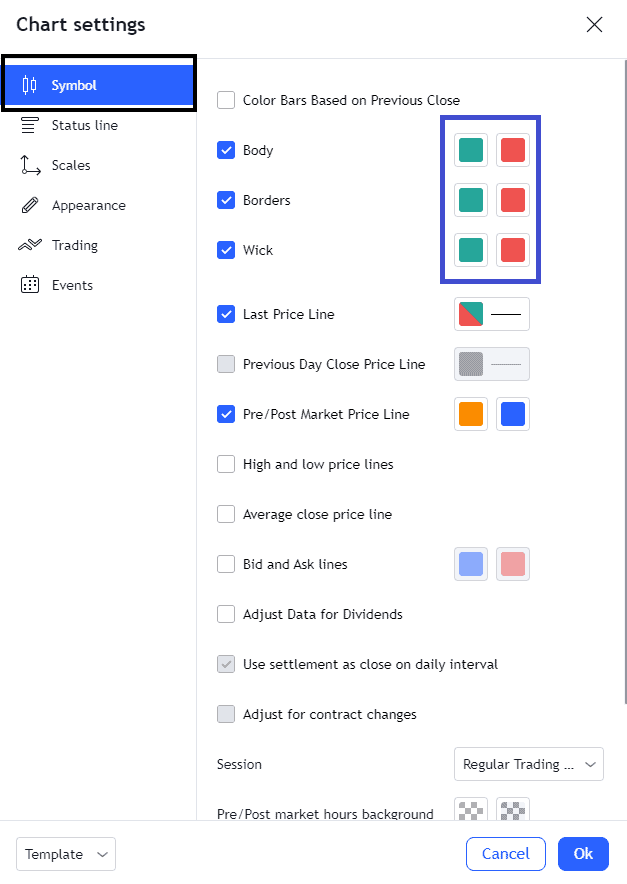
Step 3: Click the symbol tab see black box above
Step 4: Make sure the following candle elements are ticked:
- Body
- Borders – the outer lining of the body
- Wick – otherwise known as the tails
Notice the 2 color options for each element.
The left color represents the color you would like for up/gain bars
The right color represents the color you would like for down/loss bars
Step 4.1: Assign your colorways for the body, borders, and wick
Step 4.2: Once done, click Ok at the bottom
How do I change to Candlesticks in TradingView?
Switching from one chart type to another is quick and easy.
In the top main menu. Go to chart type icon to the right of the ticker symbol and time interval. In the drop down menu select ‘Candle’.
I’ve outlined these steps in the ‘How do you get the candlestick chart in TradingView’ section above for more detail.
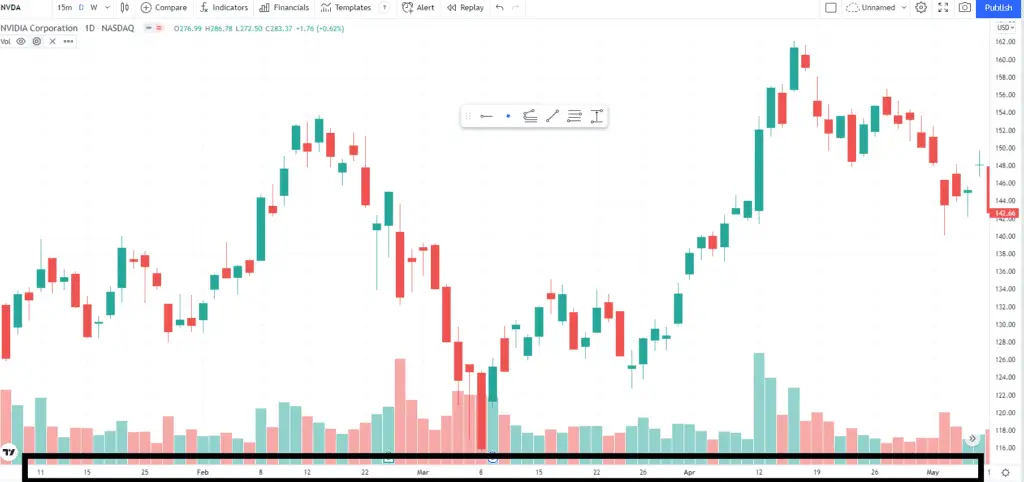
How do I change the candlestick size in TradingView?
Tradingview charts use an autoscale feature to adjust the size of the chart bars depending on the vertical and horizontal scales.
Candlestick chart bar size obviously depends on these scales.
To easily adjust these scales:
- Y axis (or price axis): click and hold-move up to increase length or move down to decrease length
- X axis (or date axis) click and hold-move right to increase width or move left to decrease width
Why can’t I see candles on TradingView?
One common reason why candles are not visible is that the data series is accidentally hidden. The quick fix is to unhide, and this can be done in one click.
Learn how to do this in the following subsection…
How do you hide/unhide candles in TradingView?
On the upper left corner of your chart, right below the toolbar, you will see the active data series on the chart (See black box below).
To hide or unhide the candles, simply click the eye icon (See black arrow above).
The action will be instantly applied to the chart.
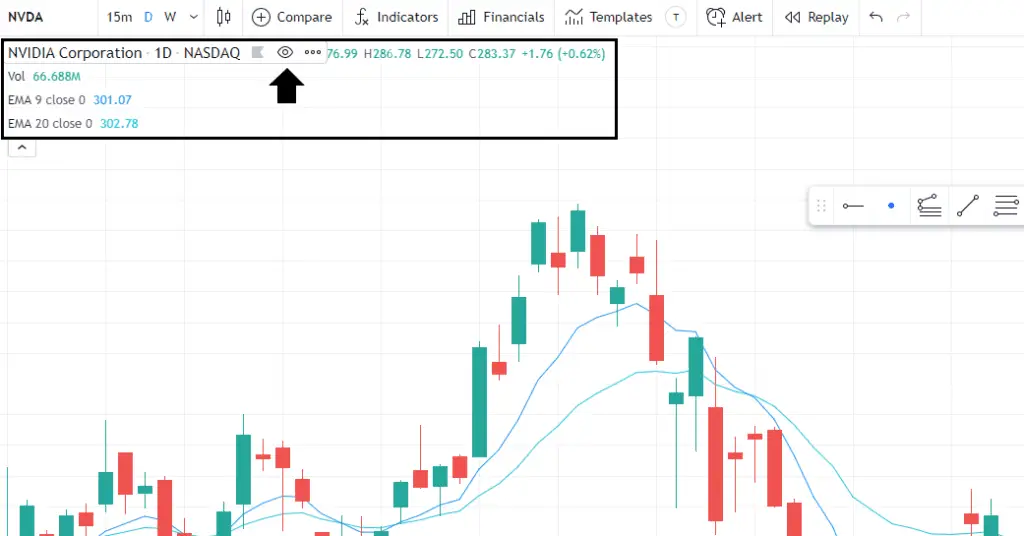
The displayed data commonly includes:
- Instrument
- Name
- Time frame of analysis
- High, low, open, close prices
- Percentage change
- Indicators
- Commonly includes the value of the indicator at the hovered bar
What are hollow candles?
Hollow candles presents data similar to candles or traditional Japanese candlesticks.
The differences between normal candles and hollow candles are there are 2 combinations of bar interpretations or 4 possible bar iterations in a hollow candle chart. For example hollow candles can either be colored and solid (shaded) or colored and hollow (unshaded). Traditional candlesticks only have solid candles.
The interpretation of hollow candles are:
- The hollow and solid characteristic compares the current closing price with the same period opening price;
- The color characteristic compares the current closing price with the previous bar’s closing price.
Sample illustration of hollow candles in TradingView
See the combinations below:
| Hollow | Solid | |
| Green | Current close price > same period open price Current close price > previous close price | Current close price < Same period open price Current close price > Previous close price |
| Red | Current close price > same period open price Current close price < previous close price | Current close price < Same period open price Current close price < Previous close price |
Signup for a Essential, Plus+ or Premium TradingView subscription using the link. *New users get $15 towards a new plan.