Tradingview has a reputation as an easy to use and initiative trading platform. that s packed full of features. One of the best features is the Tradingview drawing tools. Tradingview offers 50+ drawing tools that makes analysis on the platform a breeze!
In this post I will provide a complete guide to using Tradingview drawing tools plus answer some common question about using them.
Signup for a Essential, Plus+ or Premium TradingView subscription using the link. *New users get $15 towards a new plan.
Can you draw in TradingView?
Yes, TradingView offers a great collection of drawing tools for entry level as well as seasoned traders.
Here are some of the popular tools:
- Cursor: cross, dot, arrow, eraser
- Trend Line tools: trend line, horizontal line/ray
- Gann and Fibonacci tools: fib retracement, trend-based fib extension, pitchfork
- Geometric shapes: path*, highlighter, brush, rectangle
- Annotation tools: text, callout, price label, price note, arrow marker
- Patterns: Head and shoulders, Elliot wave
- Prediction and measurement tools: long, short, price and date range
- Icons: broad range of emojis
- Measure*: measure a range of bars
*We will learn more about this helpful tool in the later section.
Where are the drawing tools in TradingView?
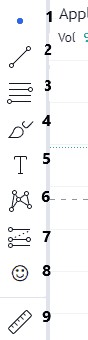
All the drawing tools are located on the left panel of the chart. The tools are organized into subgroups. Each grouping is based on the similarities in utility offered by the tools.
Each group can be expanded to reveal the more tool options.
For example, text, price labels, callouts are lumped in one group as all share the similarity of chart annotations and highlights through text and attention-grabbing arrows.
How are drawing tools used in TradingView?
Generally, drawing tools are used for chart annotation and analysis.
Most tools are similar to those found on many modern trading platforms.
What makes TradingView drawing tools stand out is how easy and initiative they are to use. They’re easy to add and manipulate on the the chart. They look clean and clear and can be highly customized.
On TradingView, drawing tools follow a ‘click-hold-drag mechanism’ for most of its tools- where you hold and drag part to extend/enlarge the drawing object.
How to use TradingView’s drawing tools
Here’s are basic step-by-step instructions on how to use drawing tools on TradingView:
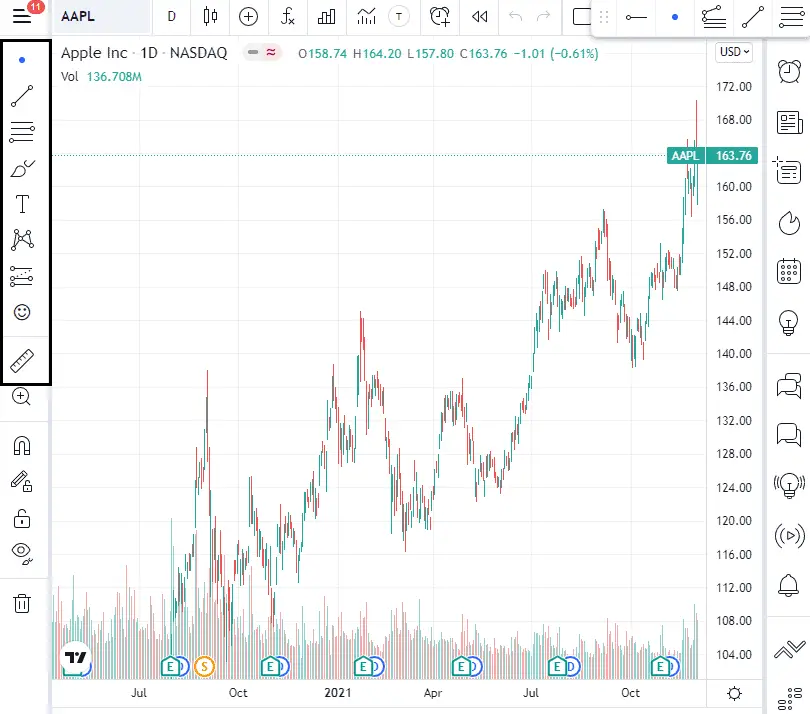
Step 1: Open TradingView chart
Step 2: Locate drawing tool panel on the left
Step 3: Select tool you would like to use
Step 3.1: Open a subgroup
In the example below, I expanded the ‘trend line tools‘ subgroup
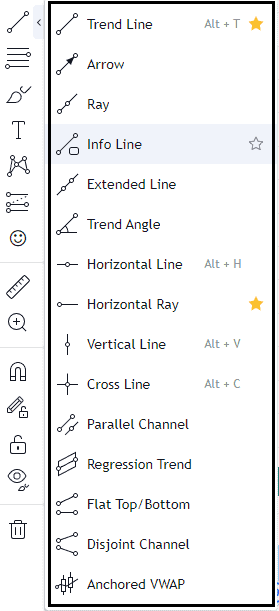
Step 3.2: Select tool from list
In the example below, I selected Trend Line
The subgroup and selected tool will automatically be highlighted by TradingView to show that it is active
Step 4: Use drawing tool via click -hold -drag mechanism or simply click*
*The mechanism will depend on the type of drawing
Step 4.1: Click the area of the chart where you want to add the drawing
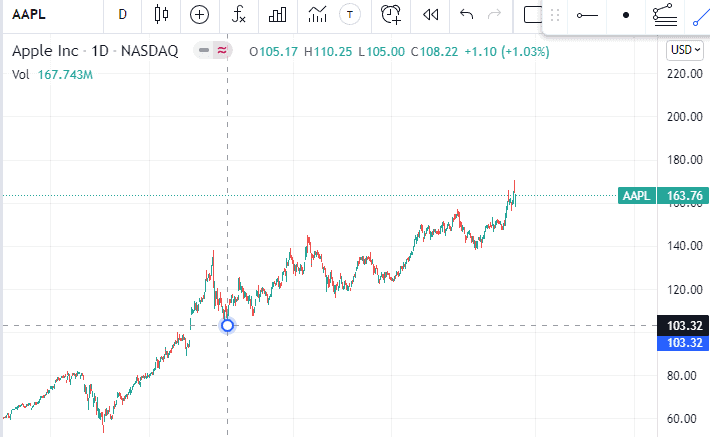
You will see that the price level of that point will be highlighted in dark blue on the Y-axis
Step 4.2: Hold to lock the starting point
Step 4.3: Drag to extend the coverage of your drawing
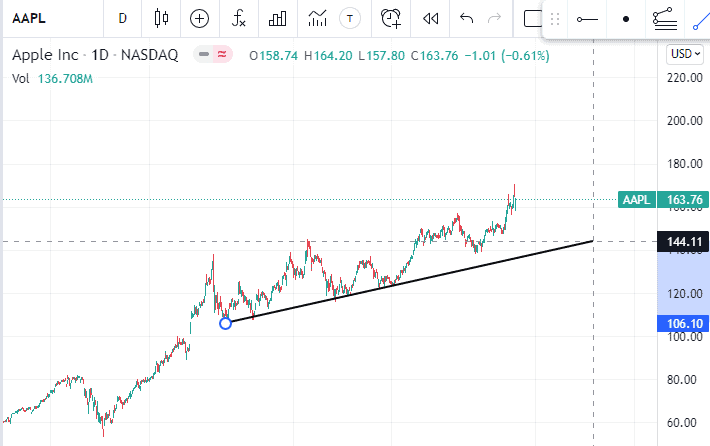
You will see that the price levels covered by the trend line is highlighted in light blue on the Y-axis
Step 4.4: Release hold to complete drawing
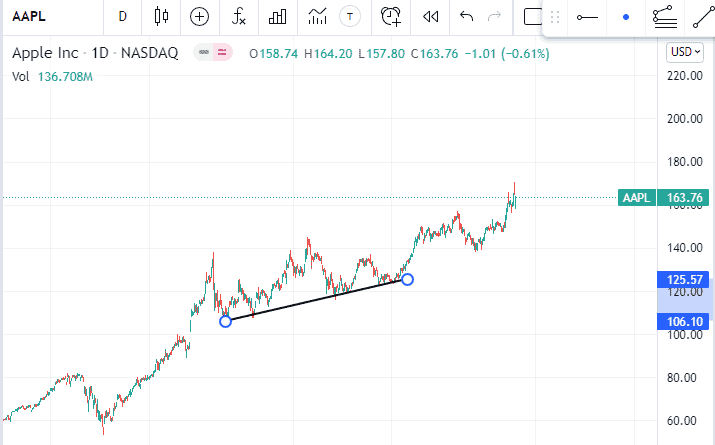
You will see that the price level of the end point will be highlighted in dark blue on the Y-axis
How do I use tools in TradingView full screen?
By default, viewing the chart in full screen mode will automatically hide the drawing toolbar.
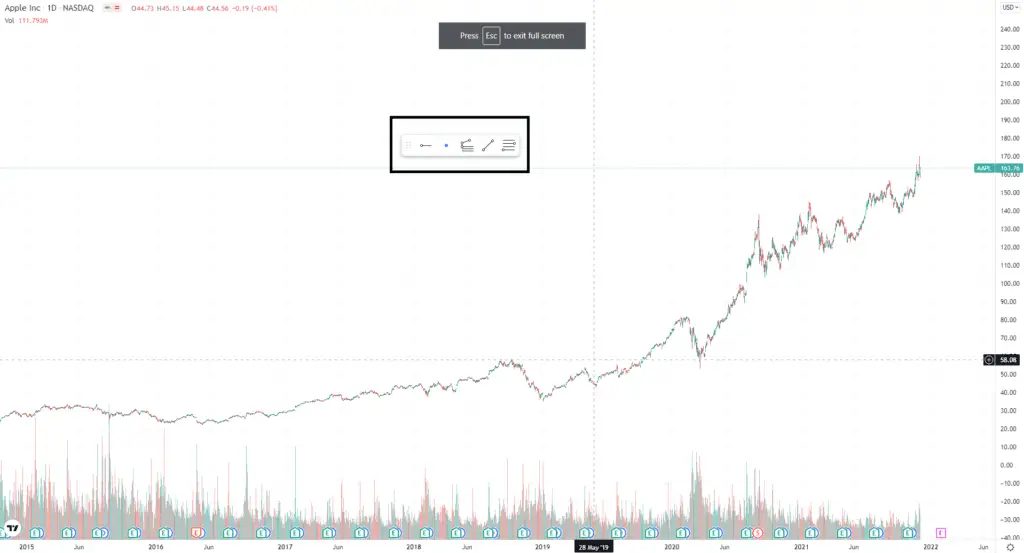
See sample below to locate the full screen button
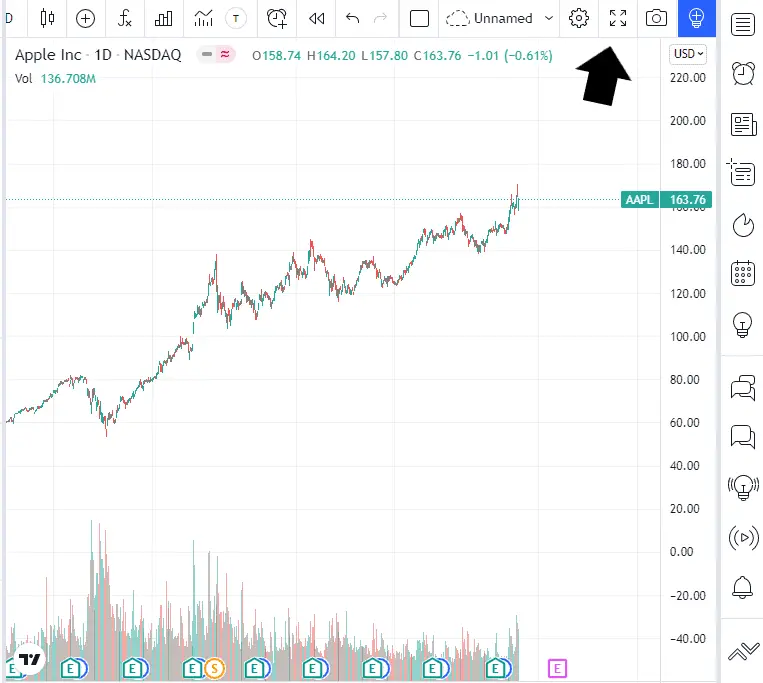
See sample below for full screen mode
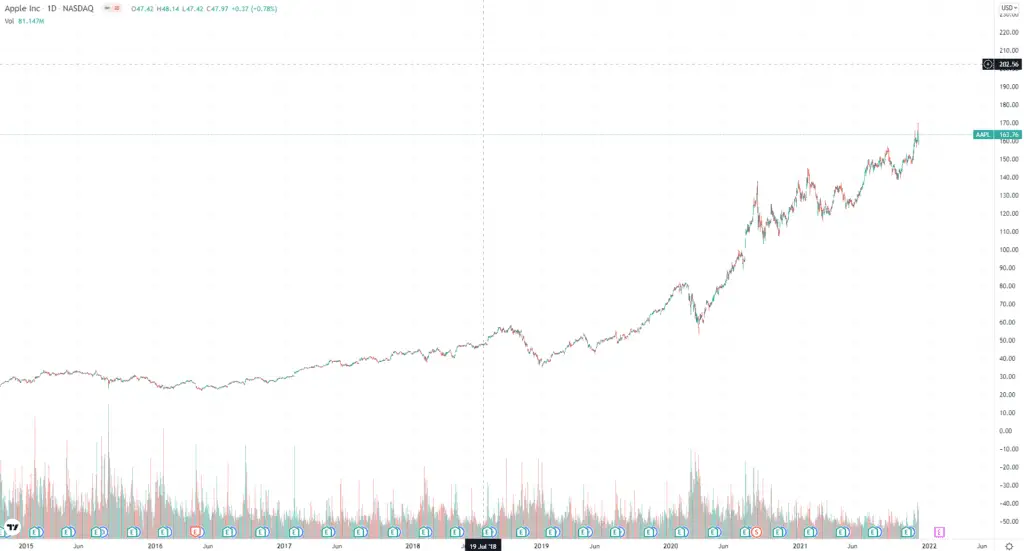
As seen above, the full screen mode hides the drawing toolbar to optimize experience.
To compensate for this, a trick we can use is to use the favorites toolbar – an onscreen floating toolbar of your favorite tools. We will learn more about how to create this later. See black box below.
Signup for a Essential, Plus+ or Premium TradingView subscription using the link. *New users get $15 towards a new plan.
How do you customize drawing tools in TradingView?
TradingView’s drawing tools can be customized to fit your aesthetic and style preferences.
Possible elements to customize are the following:
- Color
- Thickness
- Style
There are two ways to customize drawing tools and its objects:
- Floating panel (shortcut)
- Once a drawing object is completed, the floating panel will automatically appear like this:
- Here are the following elements you can customize:
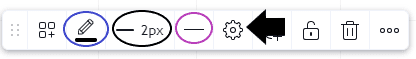
- Color see blue circle above
- Thickness see black circle above
- Style see purple circle above
- Each element has a variety of customization options that can satisfy most traders needs
- Custom window
Step 1: To open, click the gear icon from the floating panel (see arrow above);
or right click the object you want to customize:
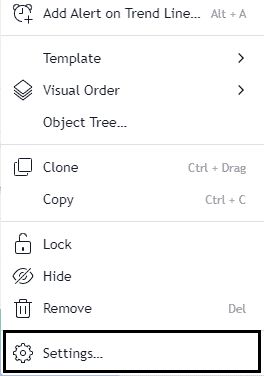
Right click view
Step 2: Click Settings from the dropdown
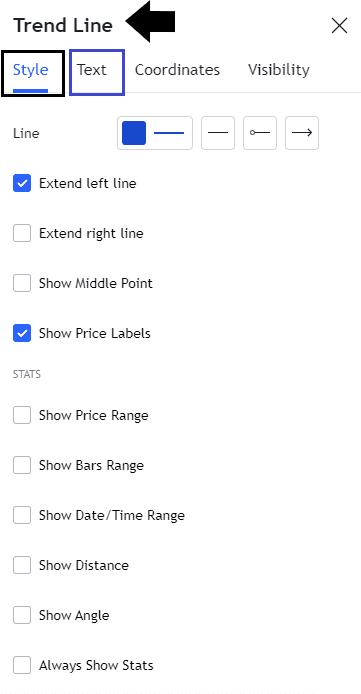
This will open a pop-up custom window of the object. You can see the name of the object as the title of the window. See black arrow below
- Here are the following elements you can customize:
Style
- Line: style, color, and style of the endpoints See circle below for sample of endpoint style
- Extension: extend either/both the left or/and right side of the line (for line and similar objects) See black box below
- Show price levels: Disabled by default, but a helpful enhancement as it marks the price levels on the y-axis of endpoints of an object (i.e., high, and low of a line) See black arrows below
Note: the levels of the endpoints will be denoted in the same color as the object
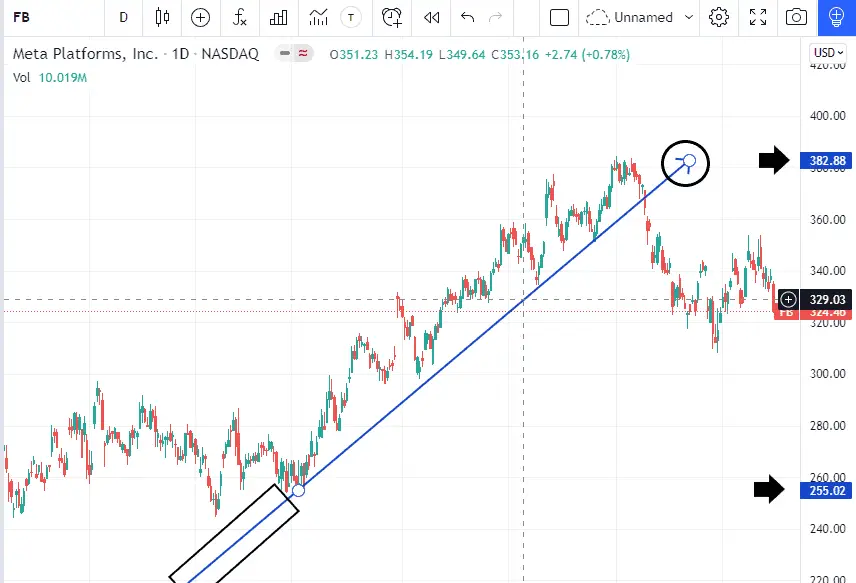
- Show price range/bars range/date and time range/distance/angle: These stats will be displayed as one floating box when hovered on the object*. See black arrow below
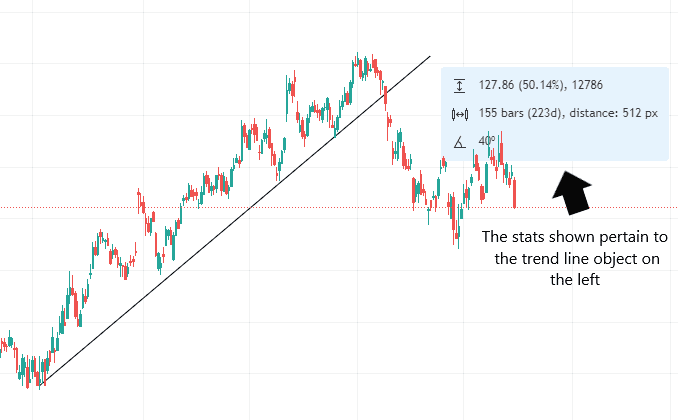
*This is the case when the “always show stats” is left unchecked.
Text
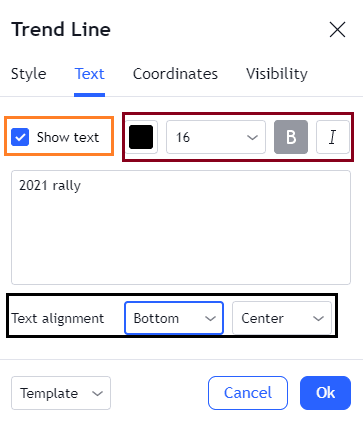
- Show text: displays text tied to the drawing object. See orange box below
- Text style: change size, color, and style (bold and/or italics). See red box below.
- Text alignment: placement of the text on the object either on top/middle/bottom, and left/center/right. See black box below.
- Text box: type in the text to be displayed on the object
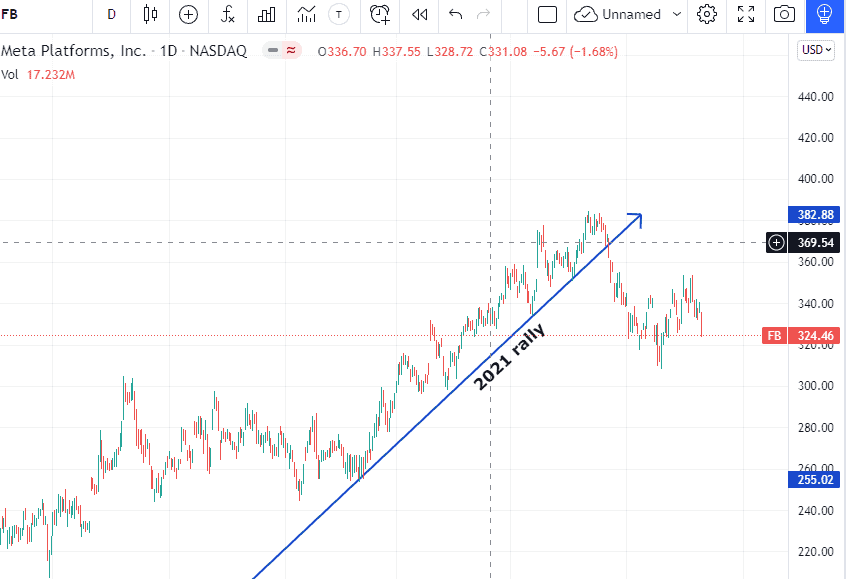
See sample below for the applied text on the trend line:
How to create a favorites toolbar in TradingView?
Frequently used or favorite drawing tools can be saved to the favorites toolbar for easy access.
The favorites toolbar is a floating toolbar on a chart. See sample below:
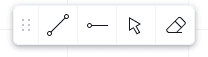
The toolbar can freely move from any part of the chart. You can do this by click and holding the 6 dots on the left then dragging it wherever you like.
Steps in creating a favorites toolbar
Step 1: Locate the drawing toolbar on the left of the chart
Step 2: Choose the drawing tool > hover over the tool. You will see a star.
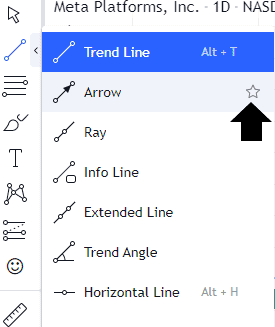
Step 3: Click the star to the right of the tool. See circle below.
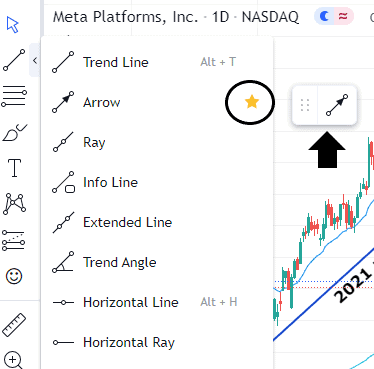
,
The favorites toolbar will also appear instantly on your chart;
The tool will automatically be added to the favorites toolbar. See black arrow above.
You can add up as much as many tools you like.
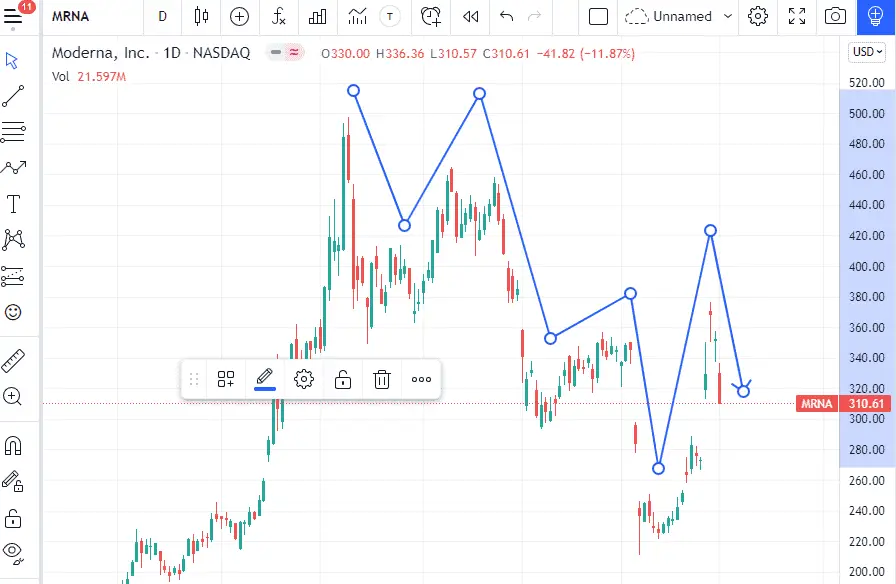
How do you draw a path in TradingView?
What is the path tool?
Released in 2020, path is one of the newer tool additions in TradingView. This tool creates a line with a series of points, instead of the usual trend line that has a limitation of two points.
By default, the end of the drawing will be an arrowhead.
Steps in drawing a path in TradingView
Step 1: Locate the drawing toolbar
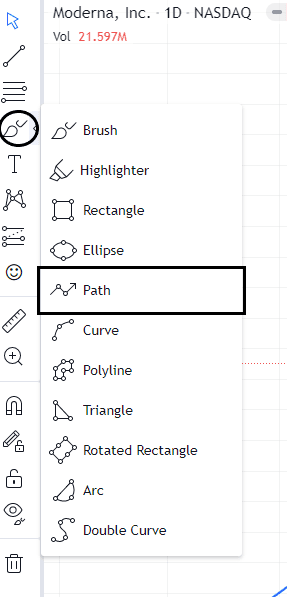
Step 2: View the Geometric Shapes group See circle below
Step 3: Select Path See box below
Step 4: Draw a path
Step 4.1: Select where you would like to put your starting point
Step 4.2: Click on the next point you would like to mark. Repeat.
Step 5: Finish drawing by double clicking the last point
See sample below:
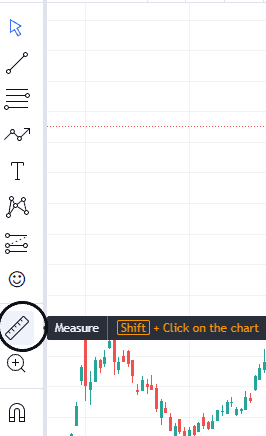
How do I use the measuring tool in TradingView?
Another really useful tool is the measuring tool. This tool simply measures the distance between two points, which includes price change in points and in percentage, number of bars (and its day equivalent), and total accumulated volume of the bars within the range of the measuring tool.
Steps in using the measuring tool
Step 1: Locate the drawing toolbar (see image above)
Step 2: Locate the ruler icon > click the icon
Step 3: Begin measuring by selecting the starting point / bar
Step 3.1: Click, hold, then drag to expand the range
Step 3.2: Release hold to mark the ending bar
The measured statistics are displayed to a box below the drawn range on the chart.
Tip: The drawing will turn blue if the end bar is higher than the starting bar. This represents a gain for the security for that range. A loss will be indicated by the color red. See sample below:
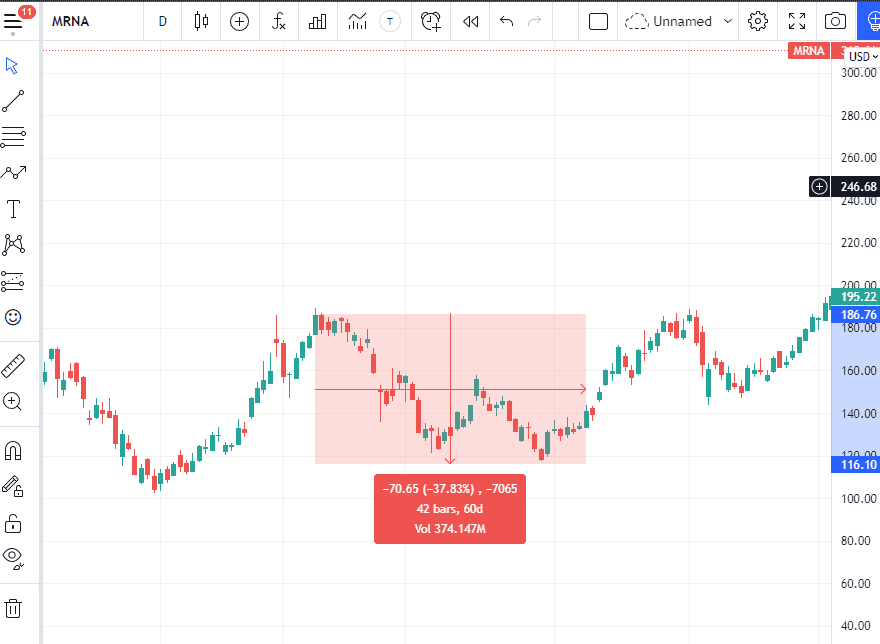
The stats are calculated based on the coverage of the drawn range.
Signup for a Essential, Plus+ or Premium TradingView subscription using the link. *New users get $15 towards a new plan.