In this post I will provide an introduction to the TradingView screener feature and provide a step by step instructions for how use TradingView stock screener, Forex screener and crypto screener.
The built in tradingview stock creener, Tradingview forex screener and TradingView crypto screener is a brilliant charting feature. The Screener is available with a free account that includes basic features. To access all the Tradingview screener features require an upgraded account is required.
Signup for a Essential, Plus+ or Premium TradingView subscription using the link. *New users get $15 towards a new plan.
What is a TradingView Screener?
A screener is a filtering tool that filters a long list of instruments (i.e., stocks, currencies, etc.) to show only those stocks/instruments that fit the specified criteria.
TradingView provides three MAIN screener categories: Stocks, Forex, and Cryptocurrency.
TradingView Screeners offer over a hundred predefined filter settings including Top Gainers, Top Losers, All Time High, Volume Gainers; even fundamental filters including PE, EPS, among others.
Tradingview screeners also provides the ability to create your own custom scans.
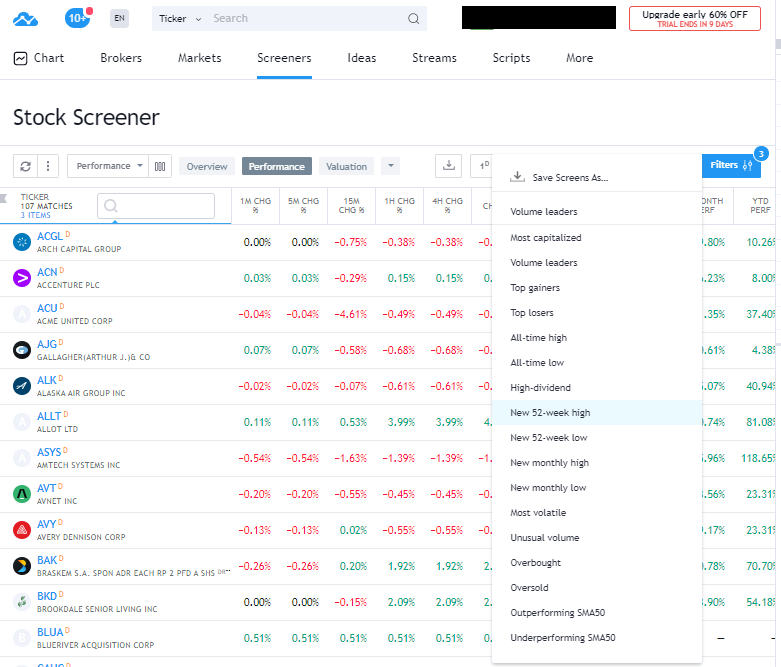
Stock Screener
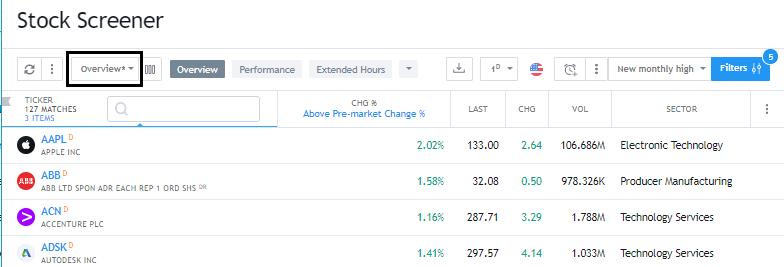
The Stock Screener filters and sorts through worldwide publicly traded companies. The screener highlights significant stock movers. Among the three Tradingview screeners, the Stock Screener offers the most filter options.
The stock screener offers a list of predefined filter settings. For example, Top gainers, top losers, All-time high etc. Click on the ‘Screeners’ dropdown menu to see a full list of predefined filter settings.
Users can also create their own custom screeners using the filters tab and save to this list (more on this below).
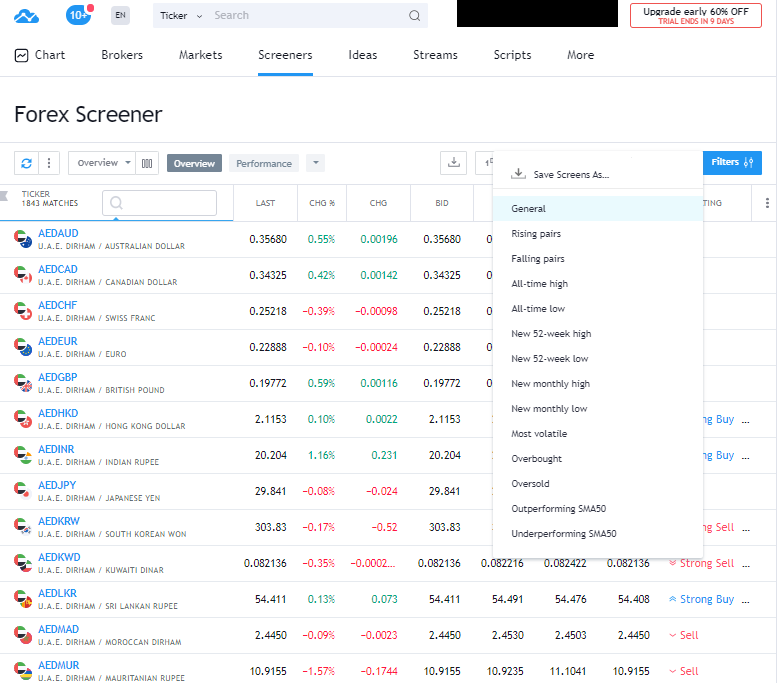
Forex Screener
The Tradingview Forex Screener is similar with the Stock Screener. This screener offers filters to track and highlight significant movements in currency pairs.
The filters within the Tradingview Forex screener are tailored specific to trading Forex.
Click on the ‘Screeners’ dropdown menu to see a full list of predefined filter settings.
Crypto Screener
The TradingView Crypto Screener sorts and filters cryptocurrencies based on certain technical criteria, timeframes, and metrics.
The TradingVeiw crypto screener offers a selection of predefined screeners and also the option to custom build a screener using the filters tab.
The filters within the TradingView Crypto screener are tailored specific to trading Crypto.

Hotlist
Apart from the three major screeners, TradingView also offers what it calls a ‘Hotlist.’
The ‘Hotlist’ displays three pre-built stock screeners. The Hotlist is identical to the stock screener. But can be displayed in the chart side bar for convenient access.
The Hotlist is only available for stocks.
Refer to the last section for a deeper dive into this useful tool.
Where to find TradingView Stock Screener, TradingView Forex Screener and TradingView Crypto Screener?
TradingView has three MAIN screeners: Stock, Forex, and Cryptocurrency. I will briefly give an overview of these screeners in this section.
There are two easy ways to access these three screeners:
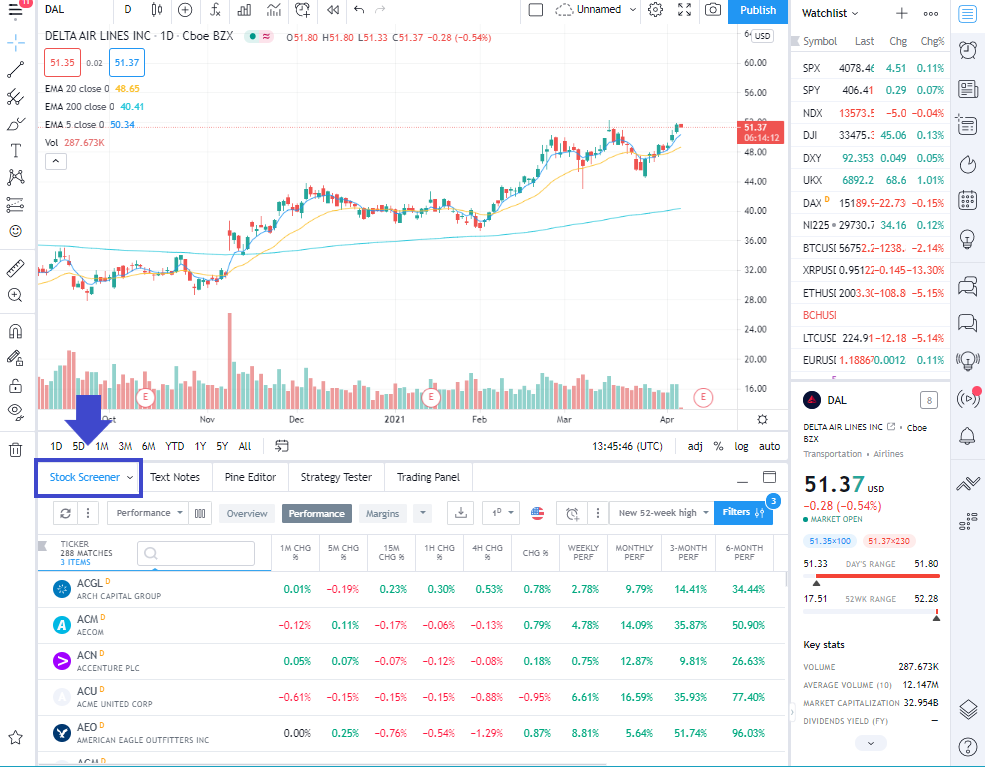
Method 1: Stock Screener tab
- Located on the bottom left of any opened Chart (See blue box and arrow below). The drop down menu will allow you to select between TradingView stock screener, TradingView Crypto Screener or TradingView Forex screener.
Method 2: Screener dropdown
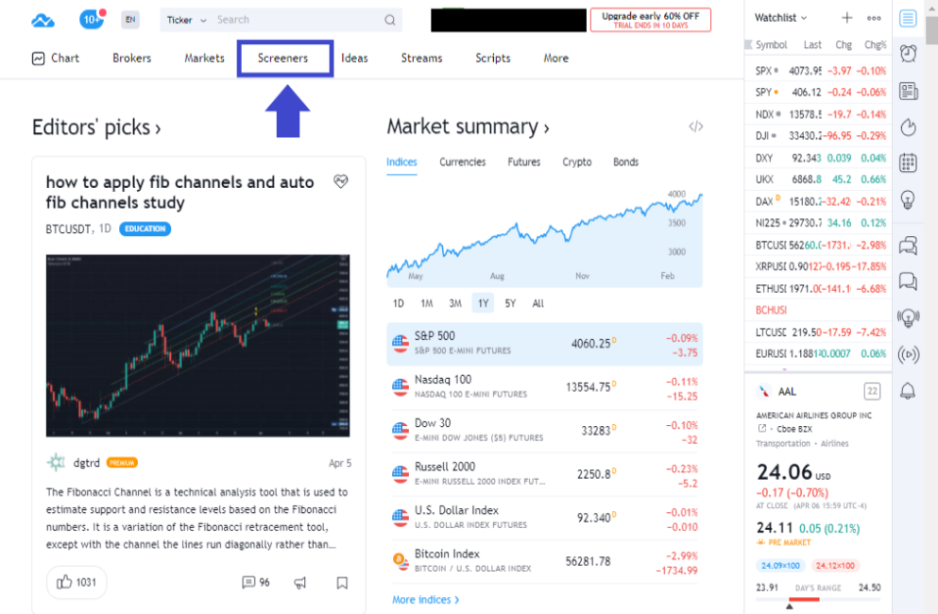
- Located on one of the main tabs at the Home page. (See blue arrow box below)
- Click to reveal the three screener software: TradingView Stock Screener, TradingView Forex Screener and Tradingview Crypto Screener.
How to use TradingView Stock Screener, TradingView Forex Screener and TradingView Crypto Screener?
Generally, the screeners operate similar to the ‘sort’ and ‘filter’ tools you find in Microsoft Excel. Its goal is to screen stock, forex, or crypto assets using a set criterion – the criteria can either be technical, fundamentals, or descriptive.
This section will discuss how to create your own custom screeners, understanding and customizing the TradingView Screener interface, and finally, understanding Hotlists.
How to create a custom TradingView Screener
To make the most of the screener tool, TradingView allows users to customize and adjust screening criteria.
You can do this by following the steps below:
Step 1: Open your screener
Refer to ‘Where to find the screener’ section above
For the purposes of this illustration, I will be using TradingView Stock Screener
Step 2: To begin customizing, click the blue ‘Filters’ button
This will open the customization menu where you will see a huge selection of of filters.
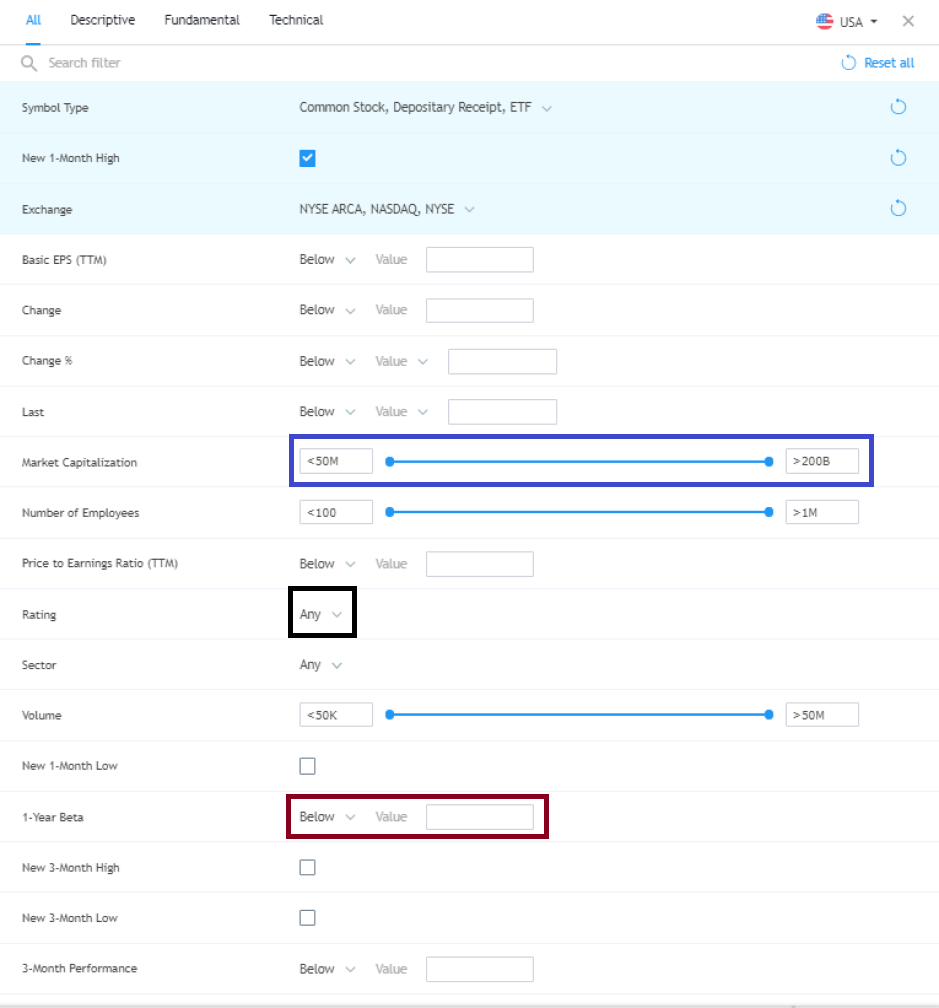
The filters can either be adjusted through:
- Slider: use to determine a range of a parameter (see blue box below)
- Drop-down: select from default options provided by platform (see black box below)
- Manual input: usually for setting value requirements (see red box below)
Understanding the Parameters
The screenshot above only shows a snippet of the adjustable parameters. As you scroll down, you will see an overwhelming amount of filter selections!
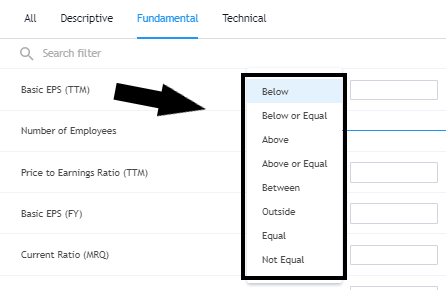
To narrow down the parameters, you may opt to look at specific parameters only. TradingView divides the parameters into three main filters: Descriptive, Fundamental, and Technical. Use the top selection tabs to filter between each of these. Or you can choose ‘All‘.
I will describe how to use and interpret each of these parameters in greater detail:
Descriptive
Descriptive filters that relate to general parameters.
There are a loads of parameters provided. These include things like: High, Low, Open, Post-market and Pre-market Close, Open, High, Low
I will discuss in detail the other common descriptive parameters that you can take a look at:
- Symbol Type
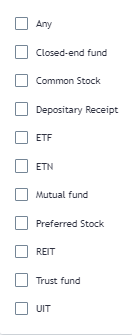
You may opt to select all by ticking Any or tick only those that you would like to appear on your screener.
- Exchange
This parameter does not always appear in the screener. Its appearance will depend on whether the selected country has multiple exchanges available.
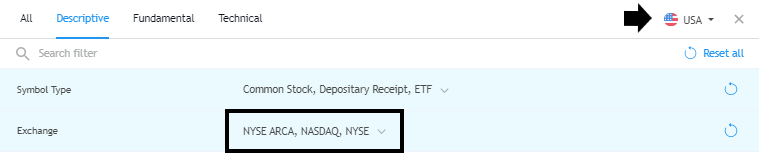
The parameter can be customized to only display certain exchanges.
- Last
This parameter allows users to set a criterion on the last price. This is helpful in terms of identifying only those stocks that are trading at prices of interest.
Setting the last price criteria is two-tiered:
- Select the position of the last price (Below, Above, Between, Equal, etc.)
- Select either as manual value input or a technical metric (see black box below)

- Market Capitalization
This parameter sets a range for market capitalization.
By default, TradingView sets the minimum value at <50M and maximum value to >200B.
You can customize this range by adjusting the sliders or setting the lower and upper bound of the range by manual input.
- Volume and Average Volume (10/30/60/90 day)
There are two main volume parameters that you can adjust using the slider/manual input of the upper and lower bounds.
The Volume parameter allows you to set the minimum and maximum daily volume requirements. Setting this will filter to display stocks that meet the requirements.
The Average Volume parameter is quite similar to the volume parameter above. The only difference is the criteria will be based on averaged volume for the past 10/30/60/90 days.
- Sector, Country, Industry
This parameter further narrow down results by deselecting the default Any selection on all three parameters, ticking only those that you would like to include on your screener.
The Sector parameter includes: Finance, Health Services, Consumer Durables, Electronic Technology, Industrials, Retail Trade, Transportation, Utilities, among others.
The Industry parameter includes: Airlines, Apparel, Biotechnology, Gaming, Computer Communications, Food Retail (Meat/Fish Dairy, Specialty/Candy, Major Diversified), Home (Furnishings, Improvement chains, building), Hotels/Resorts/Cruise lines.
Quick note: The Sector parameter is more general while Industry is more specific.
Fundamental
Fundamental filters that relate to fundamental aspects of a stock. There are more than a handful metrics available to adjust.
TradingView provides a lot of fundamental parameters to select from. To name a few:
- Number of Employees
- Number of Shareholders
- EBITDA
- Return on Equity
- Gross Profit
- Net Income
- EPS Forecast
- Net Debt
In this subsection, I will only discuss other common fundamental parameters. Many of these parameters are only customizable by inputting a particular value.
- Basic EPS (Trailing Twelve Months or TTM)
The Earnings Per Share TTM parameter screener looks through companies that meet the user’s set criteria for EPS performance in the trailing 12 months.
Select a criterion (see black box below) then set the EPS value.
- Dividends: Paid, Yield, Per share
A great screener for traders/investors looking for dividend plays.
There are three types of dividend parameters. Yield and Per Share follow the same customization ability as EPS above. Dividends Paid uses a slider to set values.
Dividends Paid allows users to set an upper and lower bound in terms of how much in dividends has been paid out by a certain company. Adjusting this metric will help identify companies with good/bad dividend payout records.
Dividend Yield and Per Share screener will look for companies that meet the yield criteria and/or per share value criteria set by the user.
- Ratios: Current, Debt to Equity, Quick, Price to Book
The ratios are customized similarly to EPS and Dividend Yield Per share.
Determine a criterion (below, above, equal, etc.) then set the value for a particular ratio.
A simple illustration of a current ratio screener is to look for companies with a ratio of between 1.5 to 3 (a common range). The criteria could then be set to between with minimum value at 1.5 and maximum at 3.
- Shares Float
An interesting parameter to customize for traders. The Share Float parameter is customized by adjusting the slider heads.
Customizing the range to a tighter or smaller value will display stocks that have low floats. These stocks are often perceived as the ones with high volatility.
Technical
Technical filters are those that relate to price performance and indicators.
The parameters can either be set with a particular value or it can be simply ticked.
Again, TradingView provides loads of parameters to choose from.
I will be focusing on some of the more common Technical parameters in detail below:
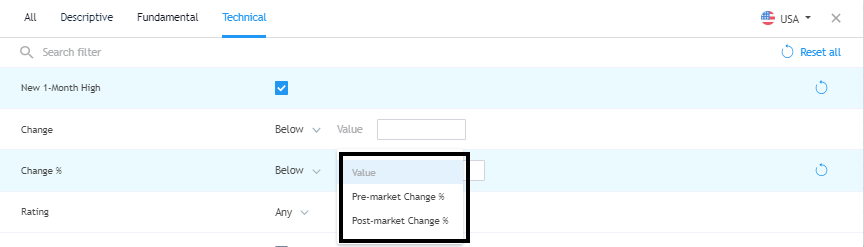
- Change and Change %, Change from Open
The difference between the two is simply the unit of measurement.
In Change, you can simply state the price change value in terms of currency/dollars.
Change %, you can state the price in percentage terms.
A helpful feature in Change % is setting it to either Pre-market or Post-market. This helps identify opportunities early on prior to actual trading.
Additionally, if you scroll further down, you will see intraday (1m,5m, 15m, 1h, 4h) change parameters. Also, a Change from Open parameter.
- New Highs and Lows (1/3/6) and 52-week Highs and Lows
Another parameter in price performance is screening for stocks that are making significant breakout moves. Applying this filter can simply be done through ticking a box/boxes.
- Moving Averages (Simple, Exponential, Hull, Volume Weighted)
In this parameter, the moving average can either be customized by determining a value for the indicator or its position relative to another moving average. (See black box below)
TradingView provides a generous amount of moving average timeframes, covering short-, medium- and long-term MAs for the Exponential and Simple MA series.

Saving Custom Screener
Once you have applied your customizations, the screener will automatically show the results that fit your specified criteria. (See black box below)
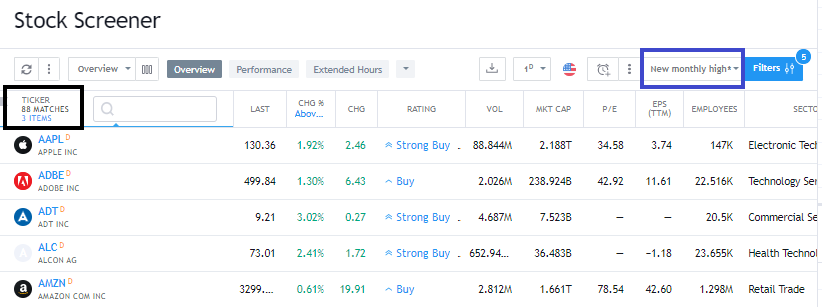
To save your customized screener, click on the button labeled as the active filter (or Screens) located on the left of the blue Filters button (see blue box above)
Select Save Screens As.

Name your Screener then click Save.
How to create custom TradingView Screener column layout
To take customization a step further, you can also customize the interface by modifying columns. You can choose to remove irrelevant columns or add more relevant filters.
There are two easy ways to do this – I will illustrate both methods step-by-step.
Adding and Removing Columns
To remove a Column:
Step 1: Open your screener
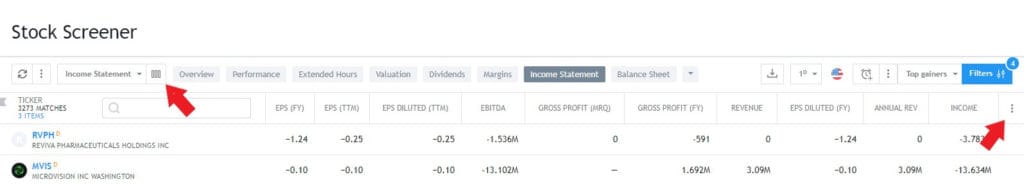
Step 2: Hover then right click on a column you would like to remove

Step 3: To remove, click Remove column (see black box above)
To Add Columns and Filters:
Step 1: Locate the 3 vertical dots along the column header; OR the 3 columns on the Main Toolbar
Tip: the 3 vertical dot icon is usually located at the right of the last column on your screener; you might need to scroll all the way to the right to see it.
In the drop down menu you can either search for a column or scroll through the selection
Step 3: Tick columns to add or remove
The ticked boxes will automatically add the filter column to your screener
Tip: Unticking boxes will automatically remove the active filter
Rearranging columns
You can arrange column position as you like. To do this simply drag and drop:
Step 1: Select column you would like to move
Step 2: Click and hold on to the column
The column title should show that it has been ‘lifted off’ its original position
Step 3: Move the column to its new position
Step 4: Once selected, ‘drop’ it by releasing the left mouse button
Saving your Customized Interface
After customizing your columns, you can save this new interface and/or apply this template to other saved screeners.
To Save a layout:
Step 1: Locate the Column Sets in the main toolbar (see black box below)
This is located on the left of the 3-column bar previously mentioned
Step 2: Click then select Save Column as
Step 3: Name your column then click Save

TradingView Stock Screener Interface overview
In this section I will give a brief overview of the interface and its components.
I will discuss these features in order of its appearance in the main toolbar/menu of the screener.

Refresh and Refresh Interval
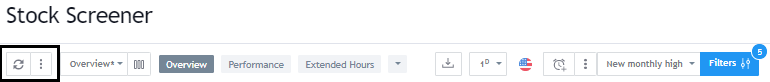
Refresh
The arrows forming a circle (similar to the ‘recyclable’ logo) is the Refresh button.
Clicking this button manually refreshes your screener to reflect the latest change in the list.
Refresh Interval
The 3-dot vertical button is called the Refresh Interval.
Clicking this button will reveal additional refresh options:
- Manually refresh (default selection)
- Refresh every 10 seconds
- Refresh every minute
You can only select one out of the three options. Activating either of the two automatic refresh options (every 10 seconds and every minute) will display a countdown of the seconds left until the next refresh.
The auto refresh feature is only available with an upgraded account.
Signup for a Essential, Plus+ or Premium TradingView subscription using the link. *New users get $15 towards a new plan.
Column Sets and Setup

Column Sets
The ‘Column Sets’ button is labeled as the name of the currently active column set. In the illustration above, the ‘Overview’ is the active column set.
Clicking this button will open all the Column Sets custom-made by the user and the default ones provided by TradingView.
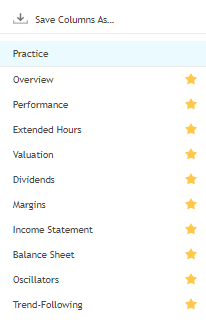
Some column sets have a yellow star beside them by default. These column sets are ‘favorited’ and will show up on the main horizontal toolbar on its favorites toolbar.
Column Setup
The Column Setup is represented by the three column bars icon.
Clicking this button will open all the available columns you can add and/or remove (as discussed above).
Favorite Column Sets

The Favorite Column Sets will appear on the main toolbar as shortcuts.
To view all of your favorites, click on the down arrow button on the right side.
Export Screener

TradingView allows users to export the data as an Excel workbook through the Export Screener button. The Export Screener is represented by the ‘download’ icon.
Clicking this button will automatically download an excel workbook CSV version of your screener.
The export feature is only available with an upgraded account.
Signup for a Essential, Plus+ or Premium TradingView subscription using the link. *New users get $15 towards a new plan.
Time Interval

The time interval is used to display stock data in reference to the time frame selected.
In the sample above, the data in the screener table will reflect performance for 1D or (1 day).
Currently, the Time intervals include: 1 min, 5 min, 1 hour, 4 hours, 1 day, 1 week, and 1 month.
Markets

The ‘Markets’ feature allows you to change the country markets that is currently active on your stock screener.
The flag icon will vary depending on the country you have selected.
Clicking the Markets icon will open a dropdown menu showing all TradingView’s covered countries.
Only one countries markets can be filtered for at once.
Alerts and Options

Alerts
The TradingView Alerts feature is also available on the TradingView screener. The Alert button is represented by the alarm clock icon.
Enabling this feature will automatically apply an alert to the current active filter. In the case above, TradingView will alert when one of the stocks makes a new monthly high.
Note: Upgraded users enjoy unlimited stock screener alerts.
Signup for a Essential, Plus+ or Premium TradingView subscription using the link. *New users get $15 towards a new plan.

Alert Options
The three vertical dot icon beside the alarm clock icon is the Options alert button.
The options available are:
- Edit Alert Settings: Allows you to modify/delete your active alerts
- Alerts Log: Displays triggered alerts
Screens

We discussed the Screens feature in the section above. The Screens button is labeled as the name of the current active screener. In the case above, it is ‘New monthly high’
Clicking the Screener button will open the dropdown list of all the screeners (both custom made and TradingView default templates). To learn more about the Screens feature, go to the ‘How to create a custom TradingView Screener’ section above.
Filters

The Filters feature is where you can customize parameters in depth.
To learn more about the Screens feature, go to the ‘How to create a custom TradingView Screener’ section above.
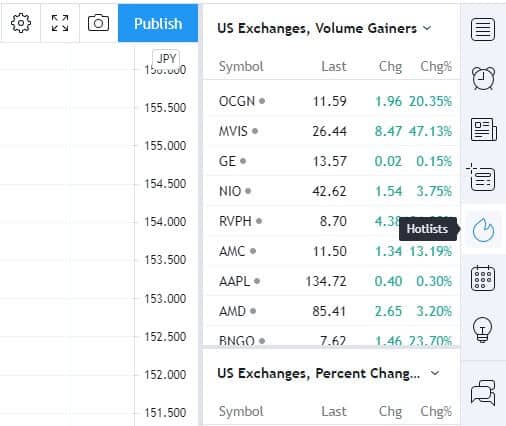
How to use TradingView Hotlists
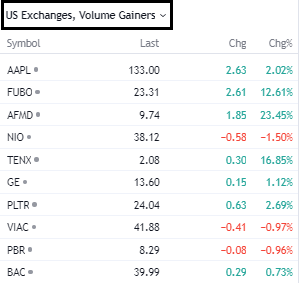
The TradingView Hotlist is a pre-built screener listed in the chart sidebar that gives a summary of symbols that meet a filter/criteria selected. (See black box below)
Hotlist Overview
Some of the pre-built TradingView Hotlist scans/filters include:
- Volume Gainers
- Percent Change Gainers
- Percent Range Gainers
- Gap Gainers
- Gap Losers
- Percent Gap Gainers
- Percent Gap Losers
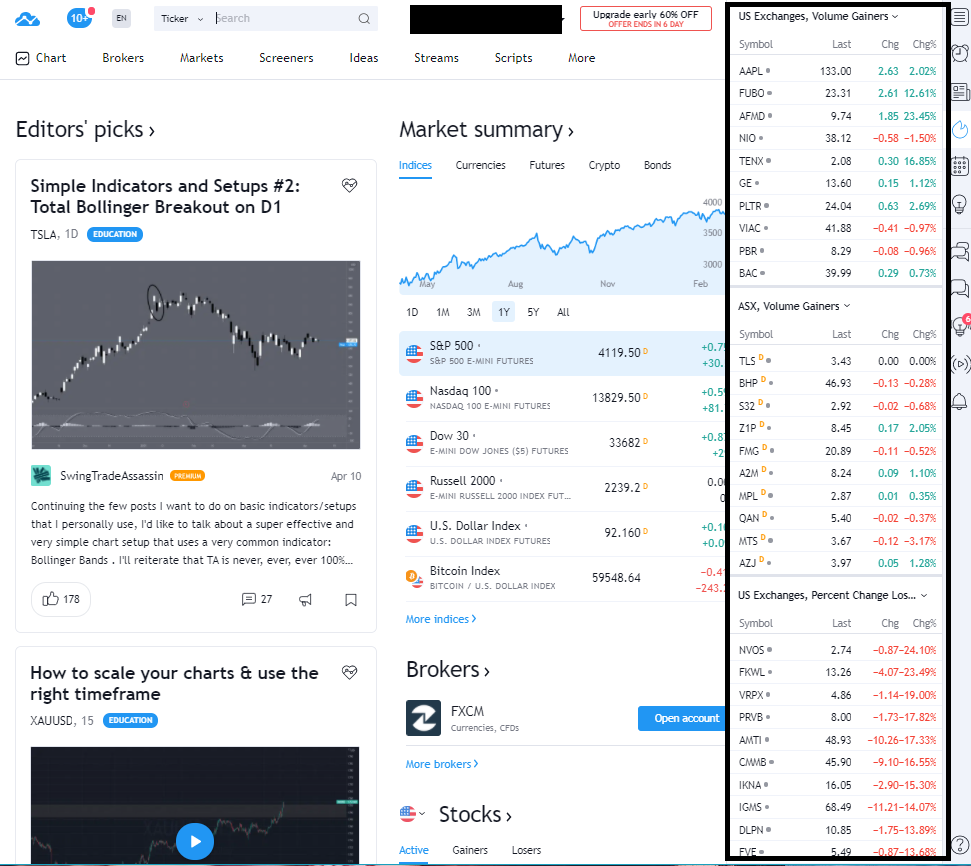
The Hotlists is a shortcut on the toolbar to the right. It is represented by the fire logo.

How to use the Hotlist
Navigating the Hotlist
The Hotlist comprises of three default lists each with their own applied filter. The hotlists can also cover different countries/exchanges.
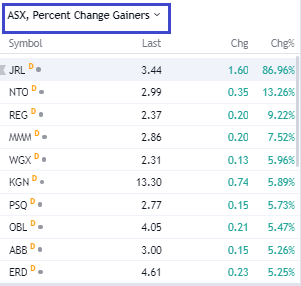
Customizing the Hotlist
Hotlists can be customized to an extent. You can customize the hotlist by adding new set of predefined filters or changing the active country.
To change a hotlist filter:
Step 1: Select a hotlist you would like to customize
Step 2: Click the down arrow on the hotlist label
Step 3: Select country and/or exchange you like > click down arrow
Step 4: Select hotlist filter
This will automatically apply the new filter to the country selected on one of the Hotlist panels.
Signup for a Essential, Plus+ or Premium TradingView subscription using the link. *New users get $15 towards a new plan.