If you are interested in using Tradingview Renko charts there’s loads of things worth understanding before jumping in head first. In this post I’ll explain all you need to know about using Tradingview Renko charts.
I’ll explain the main Tradingview Renko chart components, How to set up and configure your Renko charts. I’ll explain the different calculation methods used by Tradingview. I’ll explain why selecting the right timeframe is important. Plus how to set and adjust the brick size and how to set Renko chart alerts.
If you’re interested in trying Renko charts using Tradingview signup for a FREE TRIAL here. Or take a look at the offer below if you want to sign up for a Essential, Plus or Premium subscription.
Signup for a Essential, Plus+ or Premium TradingView subscription using the link. *New users get $15 towards a new plan.
Does Tradingview have Renko charts?
YES, TradingView offers Renko charts as one of its charting types.
Tradingview Renko charts offer loads of customization features including fully customizable brick sizes using either the traditional or ATR methods, and various source calculation options (Close or OHLC).
It’s important to note that Tradingview Renko charts use timeframe bar data to approximate tick data. To learn more about this see the ‘Tradingview Renko charts calculation methods – Close versus OHLC’ section below.
Is Renko free on TradingView?
YES, All Tradingview subcription levels have access to Renko charting. However, Free and Essential subscriptions have limited timeframe access.
Intraday Renko charts (Any time frame smaller than Daily) can only be accessed with a Plus or Premium subscription.
Also any custom timeframe interval (anytime frame other than Tradingview’s default timeframe) needs a Plus or Premium plan as well.
When using Renko charts using Tradingview it’s important to consider chart timeframes. The lower the chart timeframe used the more accurate the Renko charts. To learn more about why this is see the section below ‘Tradingview Renko charts calculation methods – Close versus OHLC’.
If your going to use Tradingview Renko charts to trade. Consider upgrading to Plus or Premium for the most accurate Tradingview Renko charts.
Signup for a Essential, Plus+ or Premium TradingView subscription using the link. *New users get $15 towards a new plan.
Overview of Renko charts on Tradingview
What are Renko Charts?
Renko is derived from the Japanese word ‘Renga’. Which loosely translates to brick.
Originating in Japan, Renko charts are a non-time based chart type that’s based solely on the magnitude of price movement.
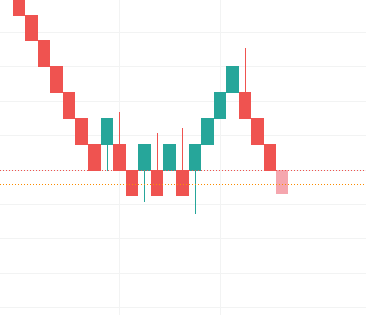
Renko charts are popularly known for their ability to smooth price movement. Renko charts are characterized by nice smooth trending moves.
Renko charts do this by forming a new brick only when price moves a specified price amount (know as Brick size) from the close (or open) of the previous Brick.
This calculation means that Renko charts favor the price movement direction of the previous Brick, since it’s easier for a new brick to form in the direction of the previous Brick than to be formed in the opposite direction since price needs to move twice the amount. Let me illustrate below:
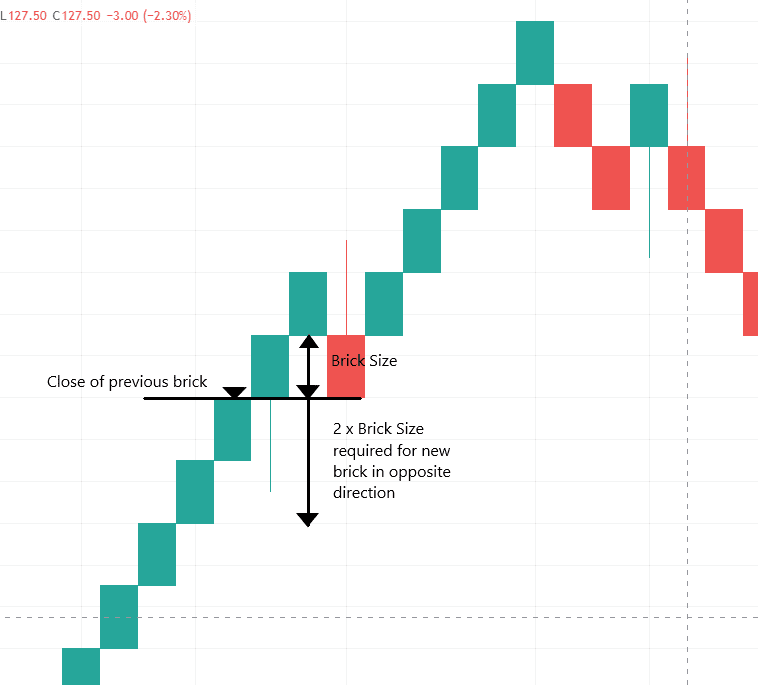
This is why we see such large smooth trending moves with Renko charts.
What are Renko charts designed for and what are they useful for?
Renko charts are designed to filter out minor price movements (smooth price) and only highlight key price trends.
The upside of this is it makes major price moves easier to identify. The downside is some price movement will be filtered out and lost.
Below is a list of some of the key ways renko charts are useful:
1. Great for identifying support and resistance levels
Renko charts are very effective for identifying key support and resistance levels. Because of the simplicity of Renko chart construction. It is very simple to identify support and resistance levels.
2. Help to identify trends
Renko charts offer a simple look at the market. The charts help identify trends in a simpler and cleaner way.
3. Good for catching larger moves
Because Renko charts are designed to filter out minor price fluctuations they are great for identifying larger price moves.
4. Removes market noise
Renko charts remove the market noise seen on typical candlestick charts. Including false breakouts, wicks and price volatility.
5. Suitable for short term trading and scalping
Because Renko charts remove market noise typical of smaller time frames they are ideal for short term trading.
6. Minimizes overtrading and increases patience
The removal of market noise encourages more patience and discourages impulsive entries and exits. Reducing overtrading.
7. Better stop loss and take profit placement
The cleaner layout of Renko charts can make stop loss and take profit order placement based on previous bricks.
Components of a Tradingview Renko Chart
The main visual component of a Renko chart is the ‘Brick’ which forms after price moves a specified number of ticks up or down. The other important components of a Renko chart are how to determine the size of these bricks and the calculation method to determine the close of each brick.
Below is a summary of each of these Renko chart components.
Bricks
Bricks are the main component of a Renko chart. Bricks are bars that form and then close only when price moves a user specified price amount.
Brick Types
Each brick can be represented by one of the following types:
| Brick Type | Overview |
| Up | Bricks closed above its previous brick |
| Down | Bricks closed below its previous brick |
| Projection up | Incomplete bricks that can potentially be an up brick based on the current price, before the closing price is set. |
| Projection down | Opposite of the above with the difference is that the potential bar is a down brick |
Brick sizes – Traditional versus ATR methods
There are two calculation method options. See TradingView’s options below:
| Method | Overview | Advantage | Disadvantages |
| Traditional | User defined brick size; the brick size value is fixed. | Brick size is consistent and predictable. | Brick size arbitrarily selected |
| Average True Range (ATR) | ATR value of a regular candlestick chart will determine the brick size. Because ATR is dynamic, brick size will fluctuate and continuously change. | Brick size value is market data drive. | Brick size and chart continuously changing |
Tradingview Renko charts calculation methods – Close versus OHLC
This is a very important concept to understand if trading Renko charts using Tradingview (and many other trading platforms).
Tradingview doesn’t support tick data. It only supports time based bars. For Tradingview to generate Renko charts either of two calculation methods are used to approximate the close of each new Renko bar.
Both these methods use time frame based data to approximate the close of each Renko bar. Tradingview uses either a timeframe based bar ‘Close’ or a timeframe based ‘OHLC’ value.
The bar ‘Close’ method uses the bar close value of the current timeframe bar (a single data point). If this chart timeframe bar close value (lets say 5 minutes) meets the criteria to form a new brick. A new Renko brick will be formed. If not, no brick is formed and the process repeats with the next 5 minute timeframe bar.
The ‘OHLC’ method uses either of the bar High/Close or Low/Close values (two data points). If any of these data meet the criteria to form a new brick when the timeframe bar closes. A new Renko brick will be formed. If not, no brick is formed and the process repeats with the next timeframe bar.
The smaller the timeframe (higher resolution) the more accurate the Renko chart calculations will be!
The OHLC calculation method captures more data points therefore generates more Renko bars.
Chart time frame (Important!)
When using Tradingview using Renko charts it’s very important to be aware of the implications of selecting the right timeframe.
To understand how Tradingview uses the chart timeframe to calculate the close of each renko brick, see the ‘Calculation methods – Close versus OHLC’ section above.
For the most accurate Renko charts using Tradingview you need to be using the smallest timeframe possible. If your using Renko charts to place trades this means you’ll definitely require a Tradingview Plus or Premium subscription to get access to intraday Renko charts.
Signup for a Essential, Plus+ or Premium TradingView subscription using the link. *New users get $15 towards a new plan.
How do I set up and configure Renko charts in Tradingview?
In the following sections I’ll describe how to setup and configure the Renko indicator in Tradingview.
Switching to Renko Charts in Tradingview
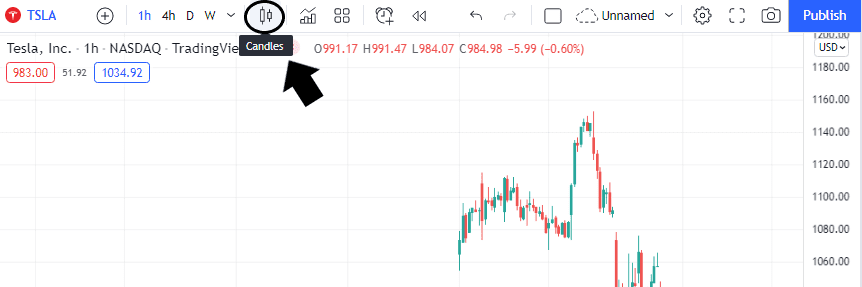
Step 1: Launch TradingView chart
Step 2: Locate the main toolbar > Click candle type to open the menu dropdown By default, ‘Candles’ are the featured chart type.
Step 3: From the dropdown, select Renko
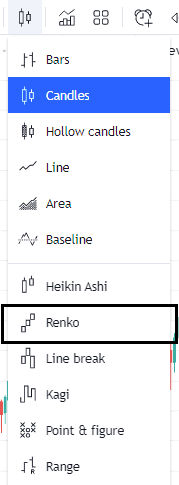
Your chart will automatically apply this change
Your chart bars will reconfigure to Renko chart style. You’ll now want to configure these bars to suit your preferences and trading style.
Configuring the settings of Renko charts
All the Renko chart configurations can be done within the settings window.
To get to settings: Right clicking on any area of the chart > Select Settings at the bottom
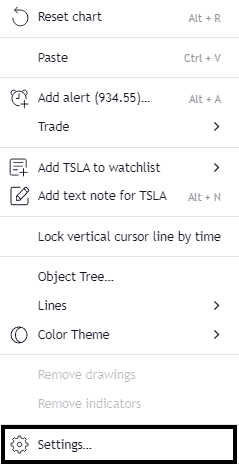
The Chart Settings window will appear:
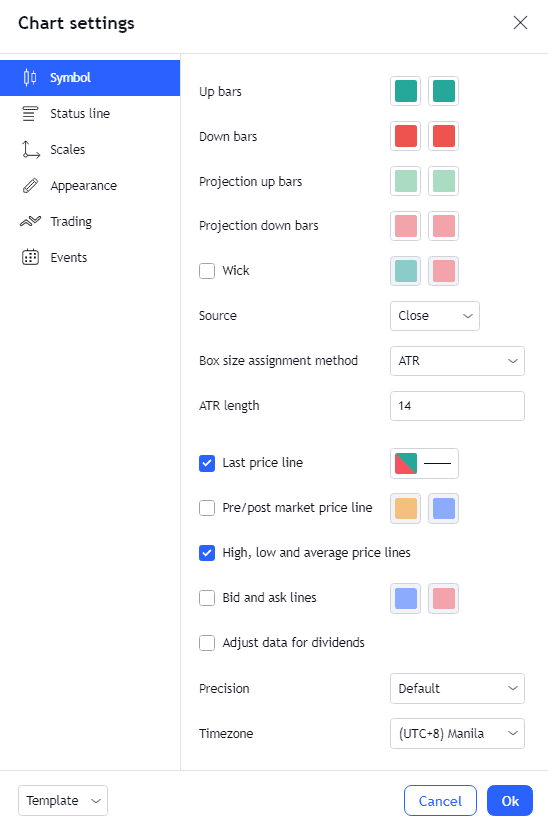
Symbol
All renko-related settings will appear within the Symbol group. Most of these settings are self explanatory. However below I’ve elaborated on some that are worth a more detailed description:
Wicks
Wicks are the tails can be enabled with Tradingviews Renko charts. Wicks represent the extent of the price movement of the brick in the opposite direction to where it closes. Wicks are created when the price moves beyond the previous bricks range but the move is not large enough to form a new brick.
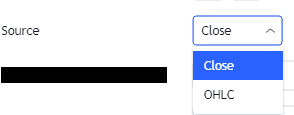
Source
‘Source’ determines whether the brick calculation will be based on timeframe bar ‘Close’ price or ‘OHLC’.
To find out more about this very important calculation method see the ‘Tradingview Renko charts calculation methods – Close versus OHLC’ section above.
Box Assignment Method and Box Value
This is where users can select the Brick sizes. Brick sizes can be selected uses either the ATR method or traditional.
ATR (Average true range) users select the number of timeframe bars to average bar price range. this value is used as the box (brick) size.
Using the Traditional method users can assign any value for box (brick) size.
How to change Renko brick size in TradingView?
In this section I’ll describe step by step how to change the box size for Tradingview Renko charts.
There are two methods for assigning brick size. The two methods are the Traditional method and the ATR method.
To understand the difference between each of these methods take a look at the ‘Brick sizes – Traditional versus ATR methods’ section above.
To assign the brick size using either of these methods follow these steps:
Step 1: Open Chart Settings window (right click anywhere on the chart)
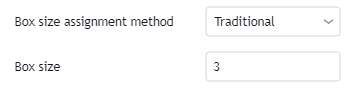
Step 2: In the Symbol tab, locate the ‘Box size assignment method’ drop down tab. Select your preferred method. Either Traditional or ATR.
Refresher: Traditional method allows users to set a fixed Box (Brick) size. ATR method assigns the box (Brick) size based of the ATR for the selected period of the chart timeframe.
Step 3: Assign value for either box (Brick) size if using the Traditional method. If using the ATR method select the period over which to calculate the ATR.
How to change Renko brick size in Tradingview for Forex
In forex trading, pips, is the common measure of currency pair movement.
Most currency pairs are quoted to up to four (4) decimal places where a pip is the smallest price move of any currency pair. 1 pip is therefore equivalent to $0.0001.
Inputting a 50 in box value is not equivalent to 50 pips.
For example, if you are trading the EUR/USD, and would like to set the box size to 50 pips using the traditional method, you should input 0.0050.
How to set alerts in Renko charts
This section will cover setting a simple alert on a Renko chart type.
If you’d like a more general guide to setting alerts using Tradingview check out my post ‘Complete guide to Tradingview alerts‘ here.
To set an alert on your Renko charts:
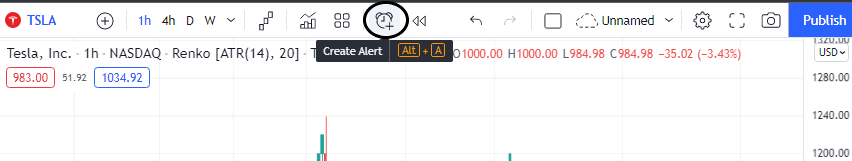
Step 1: Open Create Alert window
- Option A: From the main toolbar, locate and click the alarm clock icon
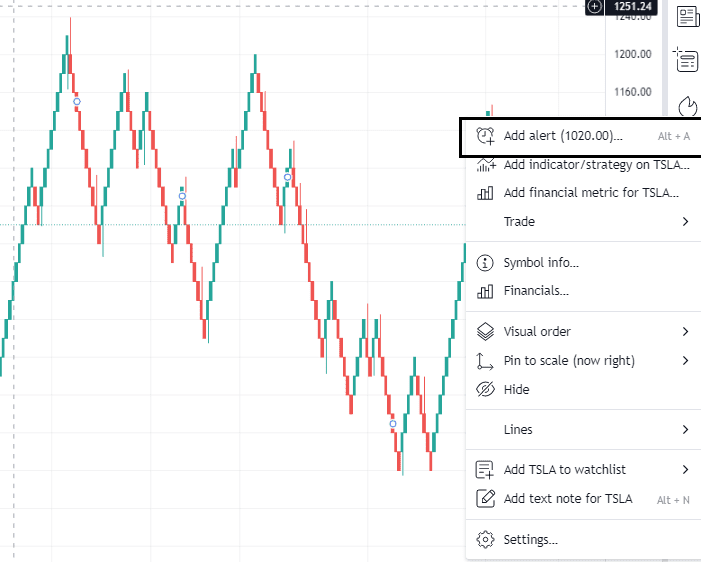
- Option B: Right click on a price of interest on the chart by selecting the specific brick area> Select Add alert <price>
- Option C: Alt + A key combination
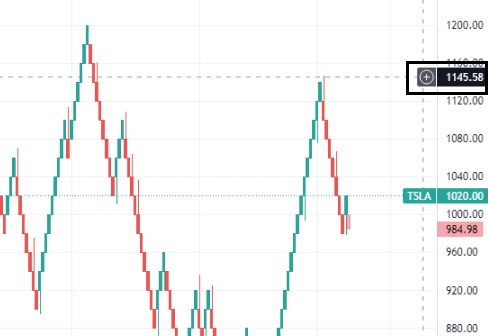
- Option D: Hover on the Y-axis > Click plus (+) button on the price level of interest for the alert > Select add alert for <symbol name> <price>
Step 2: Select condition
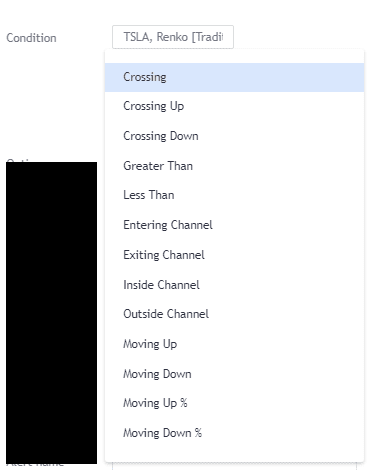
The alerts most relevant for use with Renko charts include:
Crossing, Crossing Up, Crossing Down: User is alerted when price moves and hits a predetermined price point by way of a particular direction
Greater than, Less Than: User is alerted when a price move hits a set value in magnitude (in ticks/dollars or in %)
Moving Up and Moving Down: Nearly similar to Crossing condition, where the first condition is when the price surpasses a price mark; however, the user is only notified when the price convincingly surpasses it, not merely hitting a price level like in the Crossing condition.
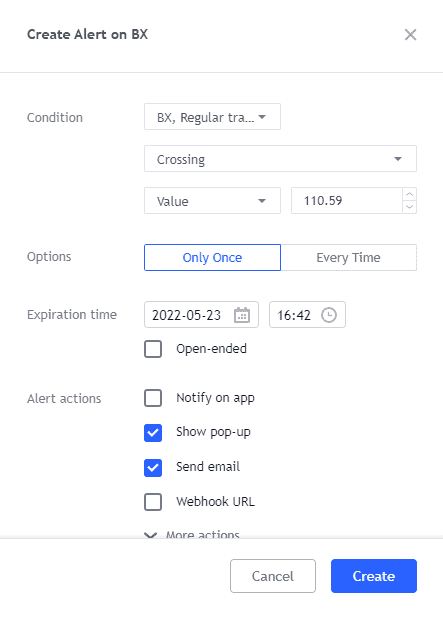
Step 3: Set value – In the ‘Create Alert’ pop up window. Under the condition section, select either Value or Vol (Volume) depending on what parameter you wan the alert to trigger.
Step 4: Set alert frequency
Choose either ‘Only Once’ (when the price level is hit) or ‘Every time’ the condition is met but not more than once per minute.
Step 5: Set date and time expiration (FREE users maximum of 2 months)
- Open-ended option – Only available with an upgraded Tradingview plan.
Step 6: Notification option: Either via App notification, Pop-up, Send email or Webhook URL. Tick as many as you like.
Step 7: Add Alert name then write a message to show on the alert
Step 8: Review then click CREATE
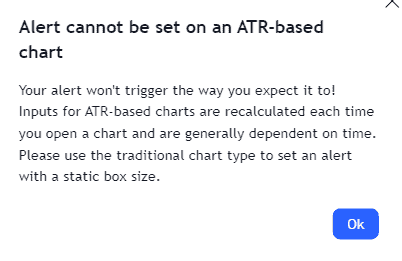
Limitation on alerts for renko charts
Renko charts with an ATR-based brick calculation cannot run alerts due to automatic and continuous recalculation of price inputs
Signup for a Essential, Plus+ or Premium TradingView subscription using the link. *New users get $15 towards a new plan.